Processing Levels
An Earth observation sensor reads the intensity of the electromagnetic spectrum collected within each pixel as a digital number (DN). These DNs represent the surface reflectance from the Earth plus contributions from atmospheric gas absorption, atmospheric scattering, variations in illumination from topographical features, instrument response curves and other artifacts. This is to say, DNs are not surface reflectance! DNs are data that require radiometric processing in order to obtain images with physically meaningful quantities like radiance or reflectance.
On top of that, depending on the sensor architecture, the pixel values may need to be stitched together to form a full image, and image distortions such as those from sensor tilt or topographical features need to be corrected for. The images also need to be referenced to a real spot on the ground. These corrections are called geometric corrections.
Hyperspectral imagery, just like any other remote sensing imagery, can be processed or corrected to different levels. These levels are standardized (to some extent) and are used to succinctly describe the stage at which the data is prepared, from raw data from the sensor to mapped variables, and beyond.
Processing Levels
Earth imagery is processed across five main levels, ranging from Level 0 to Level 4. While the precise definitions may differ depending on who you talk to, exactly whose data you're using, or the type of data, they generally follow the high-level framework given below.
| Syntax | Description | Wyvern Data |
|---|---|---|
| Level 0 (L0) | Reconstructed, unprocessed instrument data at full resolution with all artifacts removed. It should include the image data itself, image metadata, and additional relevant ancillary data with the data . | |
| Level 1A (L1A) | Reconstructed, unprocessed instrument data at full resolution, time-referenced, and annotated with ancillary information (camera settings, spacecraft altitude information, platform orbital ephemeris data, etc.). | |
| Level 1B (L1B) | Image data which has been radiometrically processed to sensor units (at-sensor radiance, or top-of-atmosphere (TOA) radiance). Includes geolocation reference information and calibration parameters required to reach this level of processing. | ✔️ |
| Level 2A (L2A) | Image data which has been atmospherically compensated/corrected to bottom-of-atmosphere (BOA) surface reflectance. | ✔️ |
| Level 2B (L2B) | L2B data are L2A data that have been processed to instrument units. | |
| Level 3 (L3) | Data that has been mapped on a uniform space-time grid, and thus have been averaged over space and/or time. | |
| Level 4 (L4) | Model outputs or results from analyses of lower level data, potentially from several data sources. |
Wyvern's L1B Data
Wyvern's hyperspectral imagery data products that are delivered in L1B processing level are both geometrically corrected via georeferencing to map-projected north-up Geographic WGS84 (EPSG:4326) coordinate system and radiometrically corrected to at-sensor radiance pixel units based on spacecraft location plus pointing along with solar conditions at time of data acquisition. Wyvern's L1B processing level imagery product is delivered as a raster dataset with 32-bit floating point (float32) data type where the pixels represent at-sensor top-of-atmosphere (TOA) radiance that is already in spectral radiance units (W m-2 sr-1 µm-1) with no need to apply any scaling factor. Wyvern's initial L1B imagery product is being delivered with adequate metadata to enable industry standard radiometric & geometric data processing along with advanced analytical techniques such as deep learning, machine learning, spectral indices, classification, anomaly detection, material identification, sub-pixel mixture analysis, and spectral target detection.
Since our L1B imagery data product is delivered in Geographic WGS84 (EPSG:4326) coordinate system the spatial X & Y cell size of any given image pixel is defined in angular longitude & latitude degree units. In order to preserve the inherent ground sample distance (GSD) of the data, the pixel cell size for any given imagery data product is set as the longitude & latitude angular degree equivalents of X = 5.0 m x Y = 5.0 m spatial size for the latitude location of the center of the image scene. Consequently, the pixel cell size in longitude & latitude degree units will be non-square and vary based on the latitude location of any given imagery data product (e.g., at 40°N latitude X = 5.0 m x Y = 5.0 m in cartesian map distance translates to Lon=0.0000586° x Lat=0.0000450° in geographic angular degrees).
Wyvern's L1B data is delivered in cloud-optimized GeoTIFF (COG) alongside STAC .json metadata.
More information about our L1B Data Product can be found in the our Product Guide
Using L1B Data
Depending on your application, L1B data may still require significant processing to make it suitable for your analysis. Over and above functional requirements, like reprojecting the data to another coordinate reference system (CRS) if it is not compatible with your existing study, or extracting your particular area of interest (AOI), keep in mind that L1B data represents TOA radiance. Absorption of light by ozone, water, carbon dioxide, and other molecules in the atmosphere prevents specific wavelengths from reaching the sensor. Accordingly, the signal-to-noise ratio (SNR) of TOA imagery in wavelengths that overlap with atmospheric absorption bands will be lower. This effect is called the atmospheric window.
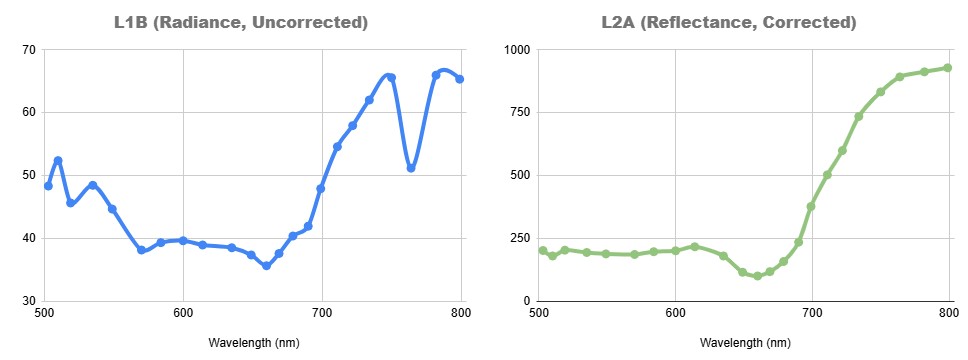
L1B compared to L2A calculated via ENVI`s QUAC (QUick Atmospheric Correction) tool.
This atmospheric absorption needs to be corrected in order to retrieve surface reflectance values (BOA reflectance). A tool like Py6S or specialized software like ENVI can help you perform atmospheric corrections. We go into more detail in the atmospheric corrections page.