Geospatial Basics
Before we dive head first into hyperspectral imagery, it's best to understand some of the fundamentals of geospatial processing. Wyvern's satellites produce raster imagery, which can then be used by geospatial analysts & tools like QGIS and Python to extract value from the data.
Details
In earth observation and geospatial processing, two main types of data are used: vector data and raster data. Vector data represents geographic features as points, lines, and polygons, and is stored as a series of coordinates. Vector data is often used to represent features such as roads, buildings, and land boundaries. One of the main advantages of vector data is that it can be easily scaled and manipulated, as it is defined by mathematical equations rather than pixels. Vector data is typically stored in file formats such as shapefiles or GeoJSON files.
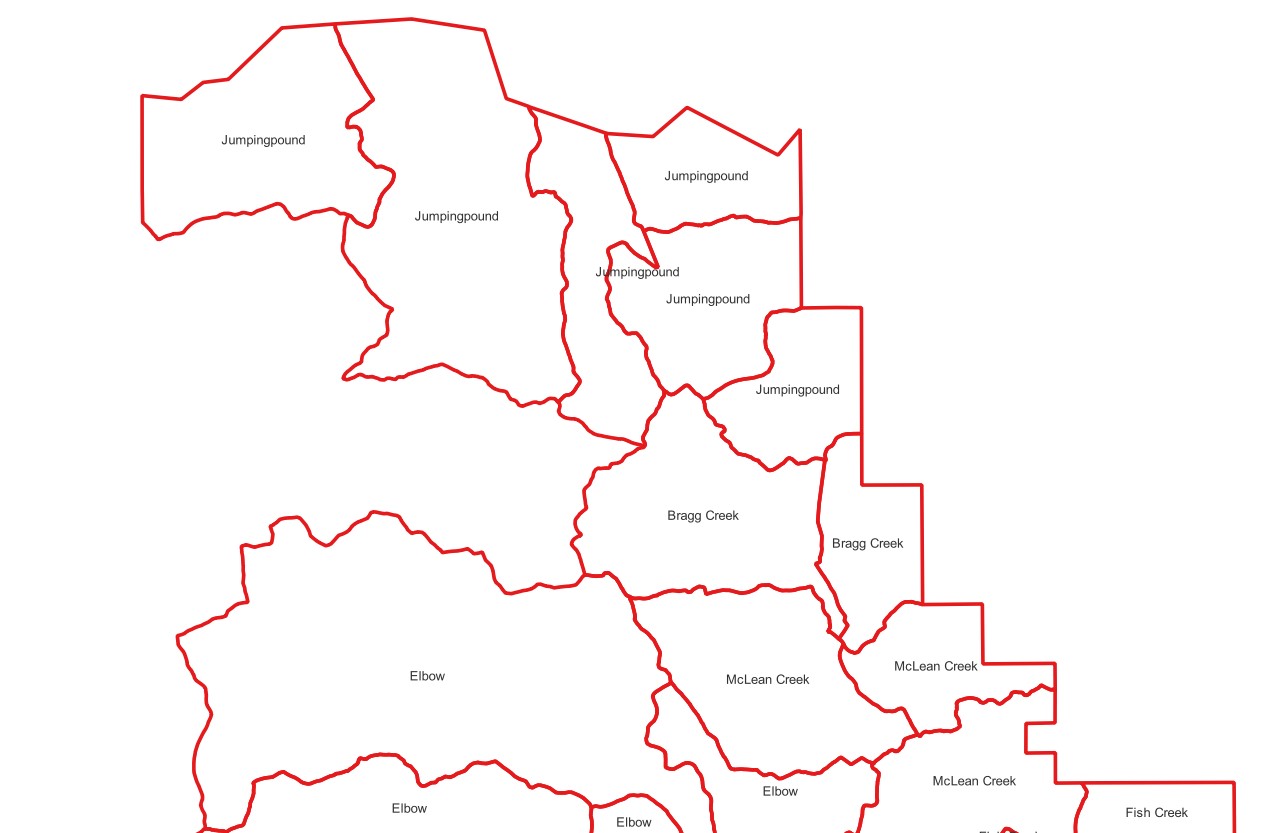
Example of vector data (grazing areas in Alberta)
Raster data, on the other hand, represents geographic features as a grid of pixels, with each pixel representing a specific geographic location. Raster data is often used to represent continuous variables such as elevation, land cover, and temperature. Raster data is typically larger in size than vector data and is more difficult to manipulate, but it is well-suited for representing detailed and complex features. Raster data is typically stored in file formats such as TIFF or GeoTIFF files.
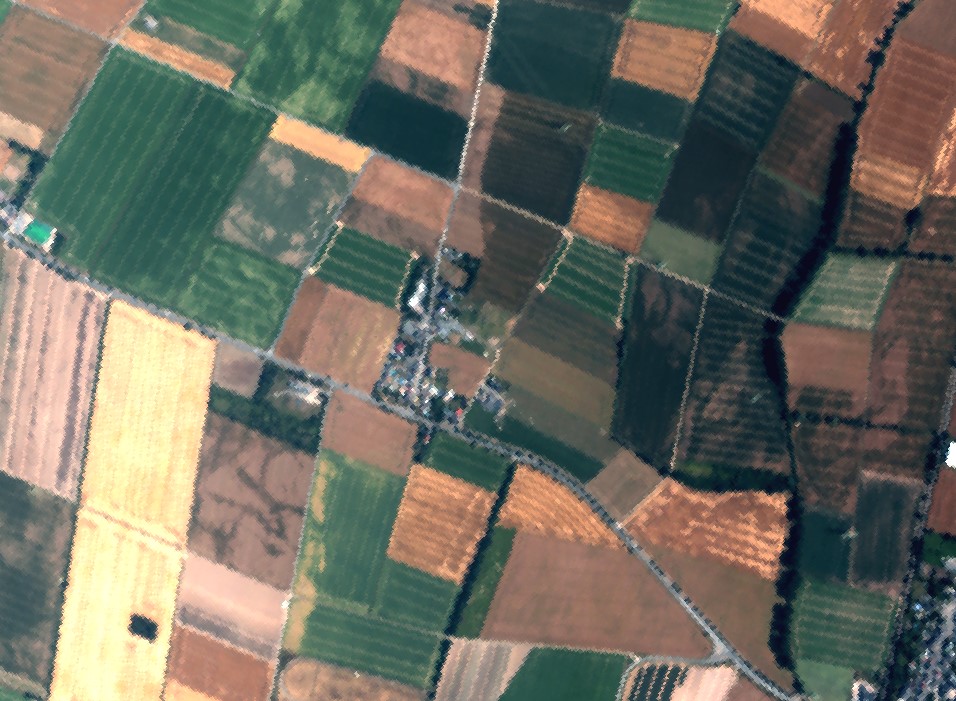
Example of raster data (farmland in Germany)
In earth observation, both vector and raster data are used to study a wide range of topics, including climate change, land use and land cover, natural disasters, and resource management. For example, vector data can be used to map buildings and infrastructure, while raster data can be used to study changes in land cover over time or to monitor the health of forests and other vegetation using vegetation indices like NDVI.
One key difference between vector and raster data in earth observation is how they are displayed. Vector data is displayed as points and shapes, commonly colored based on vector metadata, while raster data is displayed as a grid of pixels like an image. Vector data is often used to create detailed and accurate maps, while raster data is often used to represent continuous variables such as elevation or land cover.
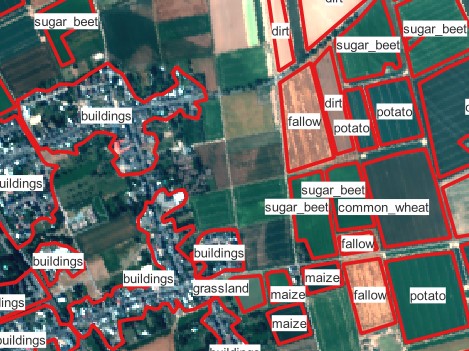
Vector data overlaid on top of raster data
In conclusion, vector and raster data are two important types of data used in earth observation and geospatial processing. Vector data represents geographic features as points, lines, and polygons, and is stored in file formats such as shapefiles or GeoJSON files. Raster data represents features as a grid of pixels (an image!) tied to a geographic location, and is stored in file formats such as TIFF or GeoTIFF files. Understanding the differences between these two types of data is essential for working with earth observation data and using GIS tools and software.