Hyperspectral Basics
Hyperspectral imaging is a relatively new technology to be commercialized. It is a type of imaging that has a wide range of potential use cases, from food processing to observing distant stars. We will be looking at hyperspectral imaging from an earth observation (EO) lens, as we operate hyperspectral satellites!
It's best to start with the electromagnetic spectrum (what we're sensing when we talk about imagery), and then different types of earth observation imaging of the electromagnetic spectrum, and you'll see how hyperspectral fits in!
Electromagnetic Spectrum
The electromagnetic spectrum refers to the full range of electromagnetic waves that are emitted by various sources. These waves have different wavelengths and frequencies, and they can be used for a variety of purposes. The electromagnetic spectrum is often divided into different categories, such as visible and near-infrared light. Visible light is the part of the electromagnetic spectrum that we can see with our eyes, while near-infrared light is just beyond the range of human vision. Both of these types of light can be used for remote sensing, as they can be detected by specialized instruments and used to gather information about the Earth and its environment.
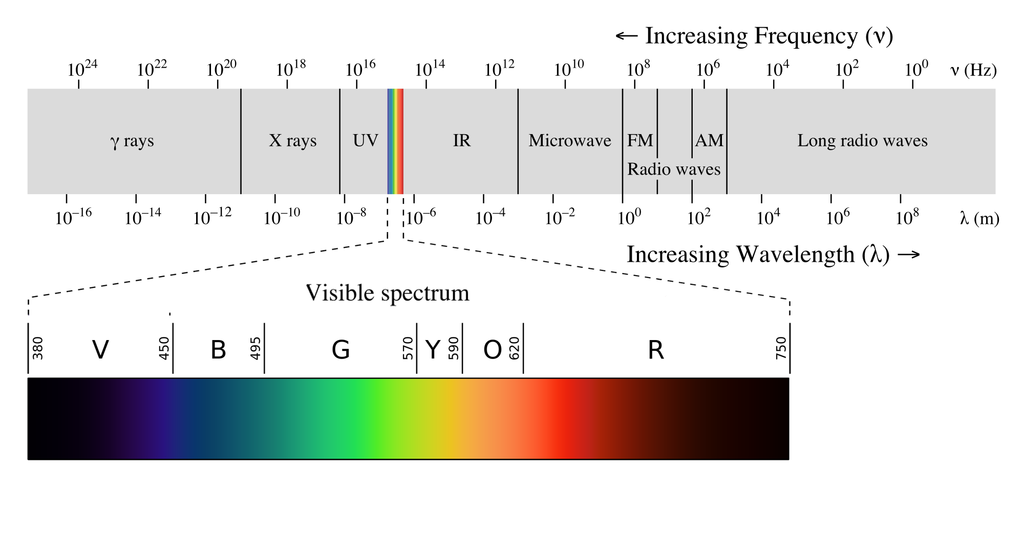
The electromagnic spectrum, with a zoomed in view of visible light's spectrum. [4]
Wikipedia provides a considerably more detailed explanation about the electromagnetic spectrum than we can provide here. In short, satellites carry instruments to sense light reflected by objects on earth, which can then be used to infer information about an objects properties.
Imagery Types
Now that we know that we're sensing the reflectance of electromagnetic radiation from objects on earth, we can dig into ways we image this electromagnetic radiation. While there are many different approaches, we'll be focusing on three common types of imaging in earth observation (panchromatic, multi-spectral, and hyperspectral). These types of imaging are differentiated based on how they sense the electromagnetic spectrum.
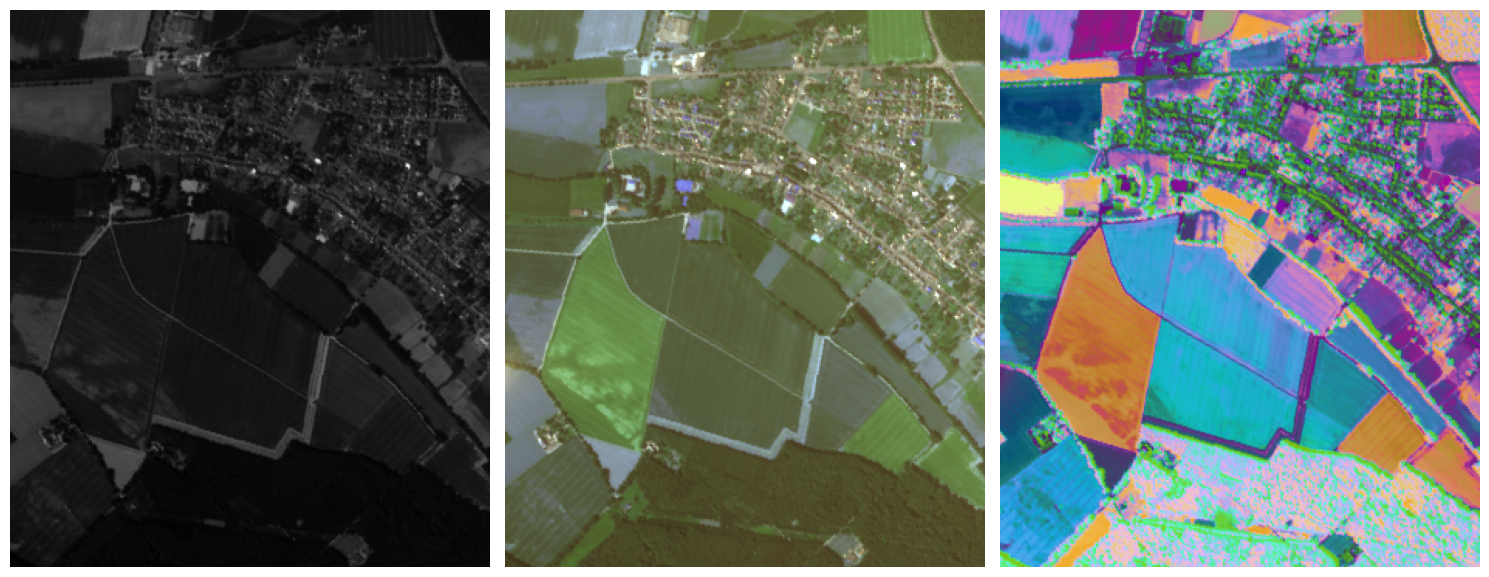
A visual example of Panchromatic, Multi-Spectral, and Hyperspectral (with dimensionality reduction) imagery; from left-to-right.
Panchromatic
Panchromatic imagery is typically used to provide a high-resolution image, which is then combined with other, low resolution bands in a process known as "pansharpening". Generating a high-resolution image typically requires more light than a low-resolution image, so instead of filtering out light into "red" or "blue" bands, all light is passed directly to the sensor. The downside of a panchromatic image is that it contains no wavelength specific ("color") information, instead only showing the relative brightness of objects. Think of it like a black and white image!
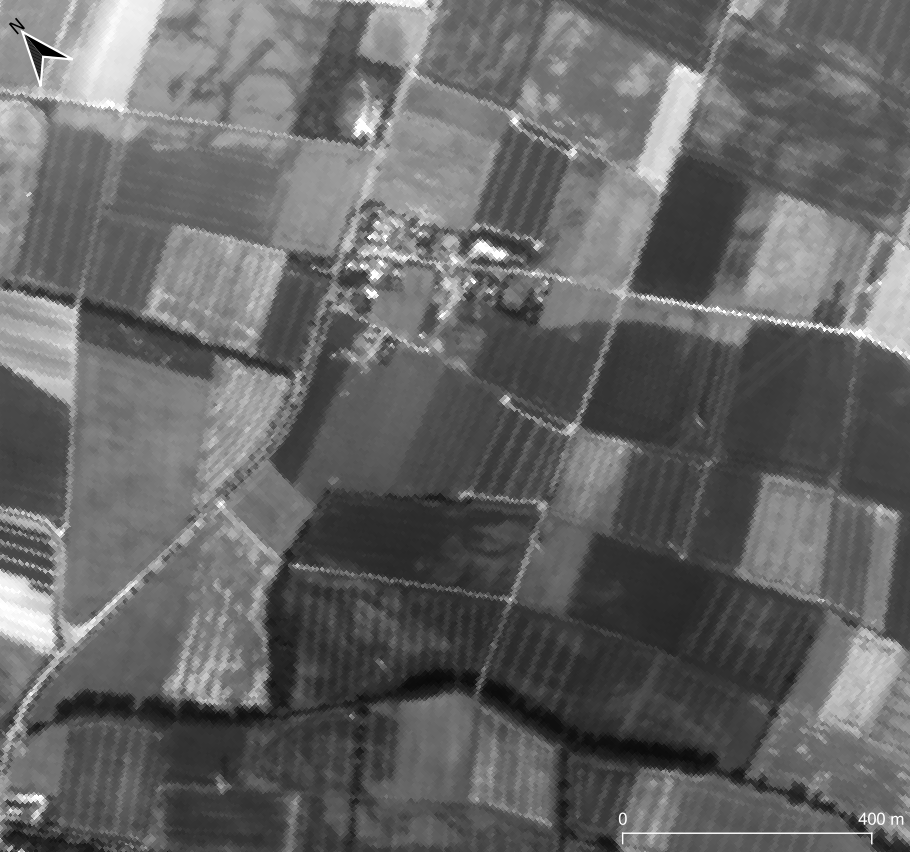
Greyscale example of a panchromatic band
Since panchromatic bands are typically designed to pansharpen lower resolution wavelength-specific bands from multi-spectral or hyper-spectral imagers, a panchromatic band will collect light from a similar range of wavelengths that the instrument is sensitive to.
Pansharpening bands outside of wavelengths the panchromatic imager is sensitive to carries the risk of inaccurate results!
Multi-spectral
Multi-spectral imagery differs from panchromatic imagery in the sense that it is collecting wavelength-specific information. It uses fairly wide bandwidths (think of it like collecting most of the light we would consider "blue" or "red"). Typically MSI collects information about red, green, blue, and near-infrared wavelengths; with some imagers also collect short-wave infrared (SWIR), and the area between red and near-infrared ("red edge").
Since multi-spectral imagers typically use wide bandwidths, there is the potential for "bleed-over", where light from one band is also picked up by another band. Figure 1, below, shows a good example of wide band-widths and "bleed-over". The "Blue" and "Green" bands can be seen to have significant overlap of their sensitivity.
![Figure 1: Spectral response and band overlap of PlanetScope Dove Satellites [1]](/assets/images/planetscope_spectral_response-8111784ca4247f6ed08d02988d2f37db.png)
Figure 1: Spectral response and band overlap ("bleed-over") of a typical, 4 band multispectral satellite.
Below in Figure 2 is an example of 3 commmonly imaged items; soil, vegetation (crops, forest, etc), and water. Multi-spectral bandwidths are represented by the grey bars. It can be seen that typical multi-spectral bandwidths do not cover the entire spectrum, and lack considerable information. That being said, multi-spectral bands are still capable of differentiating between commmonly imaged spectra, specficially due to the considerably different reflectance of vegetation in the near-infrared and mid-infrared ranges.
![Figure 2: Example of spectrum of soil, vegetation, and water. Each spectrum has a distinct shape [2]](/assets/images/commonly_imaged_spectra-8815639105ae40697b072c91e9a5dfd1.png)
Figure 2: Commonly imaged spectra [2]
Hyperspectral
Hyperspectral imagery goes a step further than multi-spectral imagery. Instead of a small number of bands with wide bandwidths, hyperspectral imagery has a large number of bands with small band widths. This allows a considerably more detailed analysis of reflectance spectra. Figure 3 details a good example of many, small band widths covering the visible to near-infrared (VNIR) spectrum.
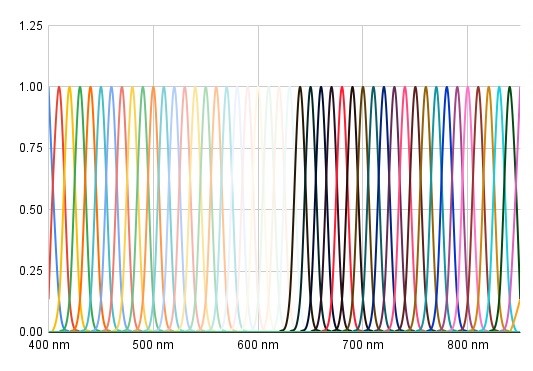
Figure 3: Example spacing of hyperspectral bands across the VNIR spectrum
There are significant advantages to hyperspectral bands for measuring everything from vegetation health, soil quality analysis, to greenhouse gas (GHG) detection. Wyvern's first generation of satellites will provide bands in the VNIR spectrum, while our second and third generation satellites will bring detailed hyperspectral monitoring into the SWIR spectrum. There are also disadvantages to hyperspectral imagery. Due to the increased number of bands, hyperspectral imagery has considerably bigger file sizes. This can result in data storage challenges, as well as increased processing time for analysis of imagery.
![Figure 4: Example of hyperspectral reflectance curves for various vegetation [3]](/assets/images/reflectance_spectra-3b2cafb9c6d628f1144deb6a4a679530.png)
Figure 4: Example of hyperspectral reflectance curves for various vegetation [3]
In Figure 4, we can see that various types of vegetation have different reflectance curves. With hyperspectral band widths, we can easily start to differentiate vegetation based on how it reflects light. With multi-spectral imagery's wide band widths, we may lose some of the nuance of the data, making differentiation of different vegatation types more difficult. This also applies to other substances like soil, minerals, water, and more!
References
[1] Schill, Steven & McNulty, Valerie Pietsch & Pollock, F. & Lüthje, Fritjof & Li, Jiwei & Knapp, David & Kington, Joe & McDonald, Trevor & Raber, George & Escovar-Fadul, Ximena & Asner, Gregory. (2021). Regional High-Resolution Benthic Habitat Data from Planet Dove Imagery for Conservation Decision-Making and Marine Planning. Remote Sensing. 13. 4215. 10.3390/rs13214215.
[2] Pham, Binh. (2018). Satellite remote sensing of the variability of the continental hydrology cycle in the lower Mekong basin over the last two decades. 10.13140/RG.2.2.27136.07686.
[3] Govender, Megandhren & Chetty, Kershani & Bulcock, Hartley. (2007). A review of hyperspectral remote sensing and its application in vegetation and water resource studies. Water S.A. 33. 10.4314/wsa.v33i2.49049.
[4] Ronan, Gringer. EM spectrum, revised diagram with re-aligned spectrum. commons.wikimedia.org/wiki/File:EM_spectrumrevised.png