Index Calculations in QGIS
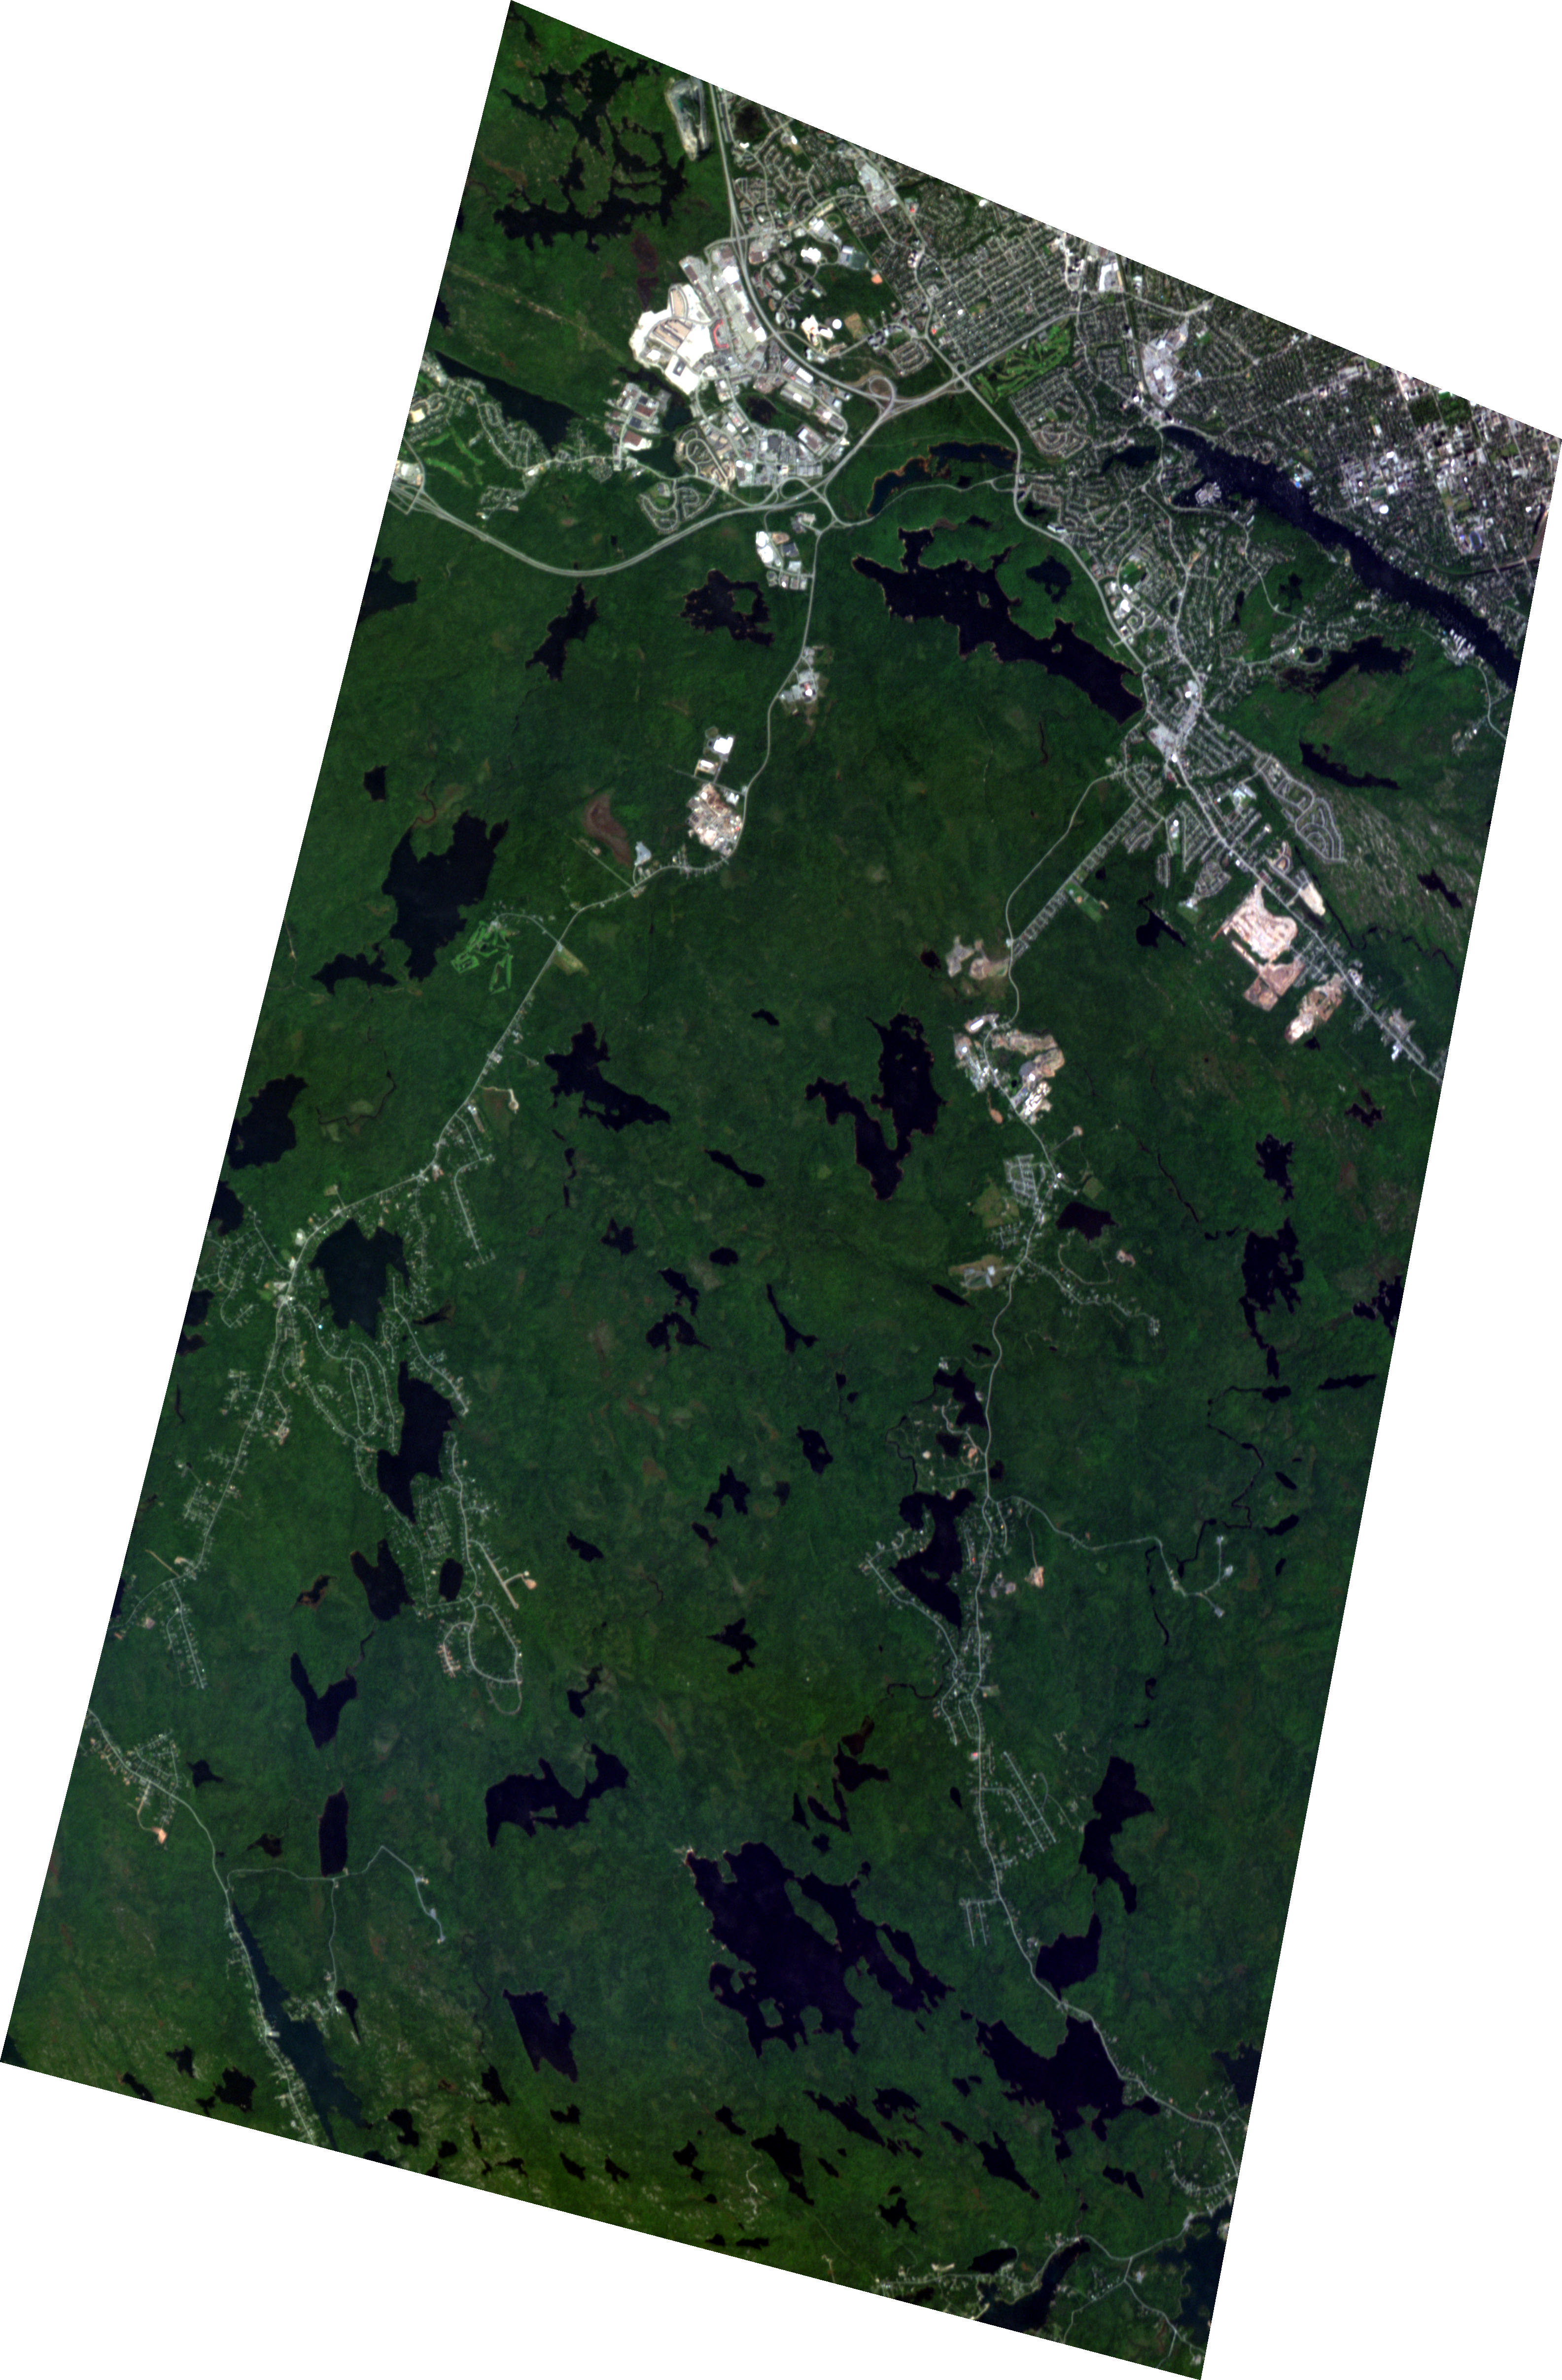
Natural colour
RENDVI
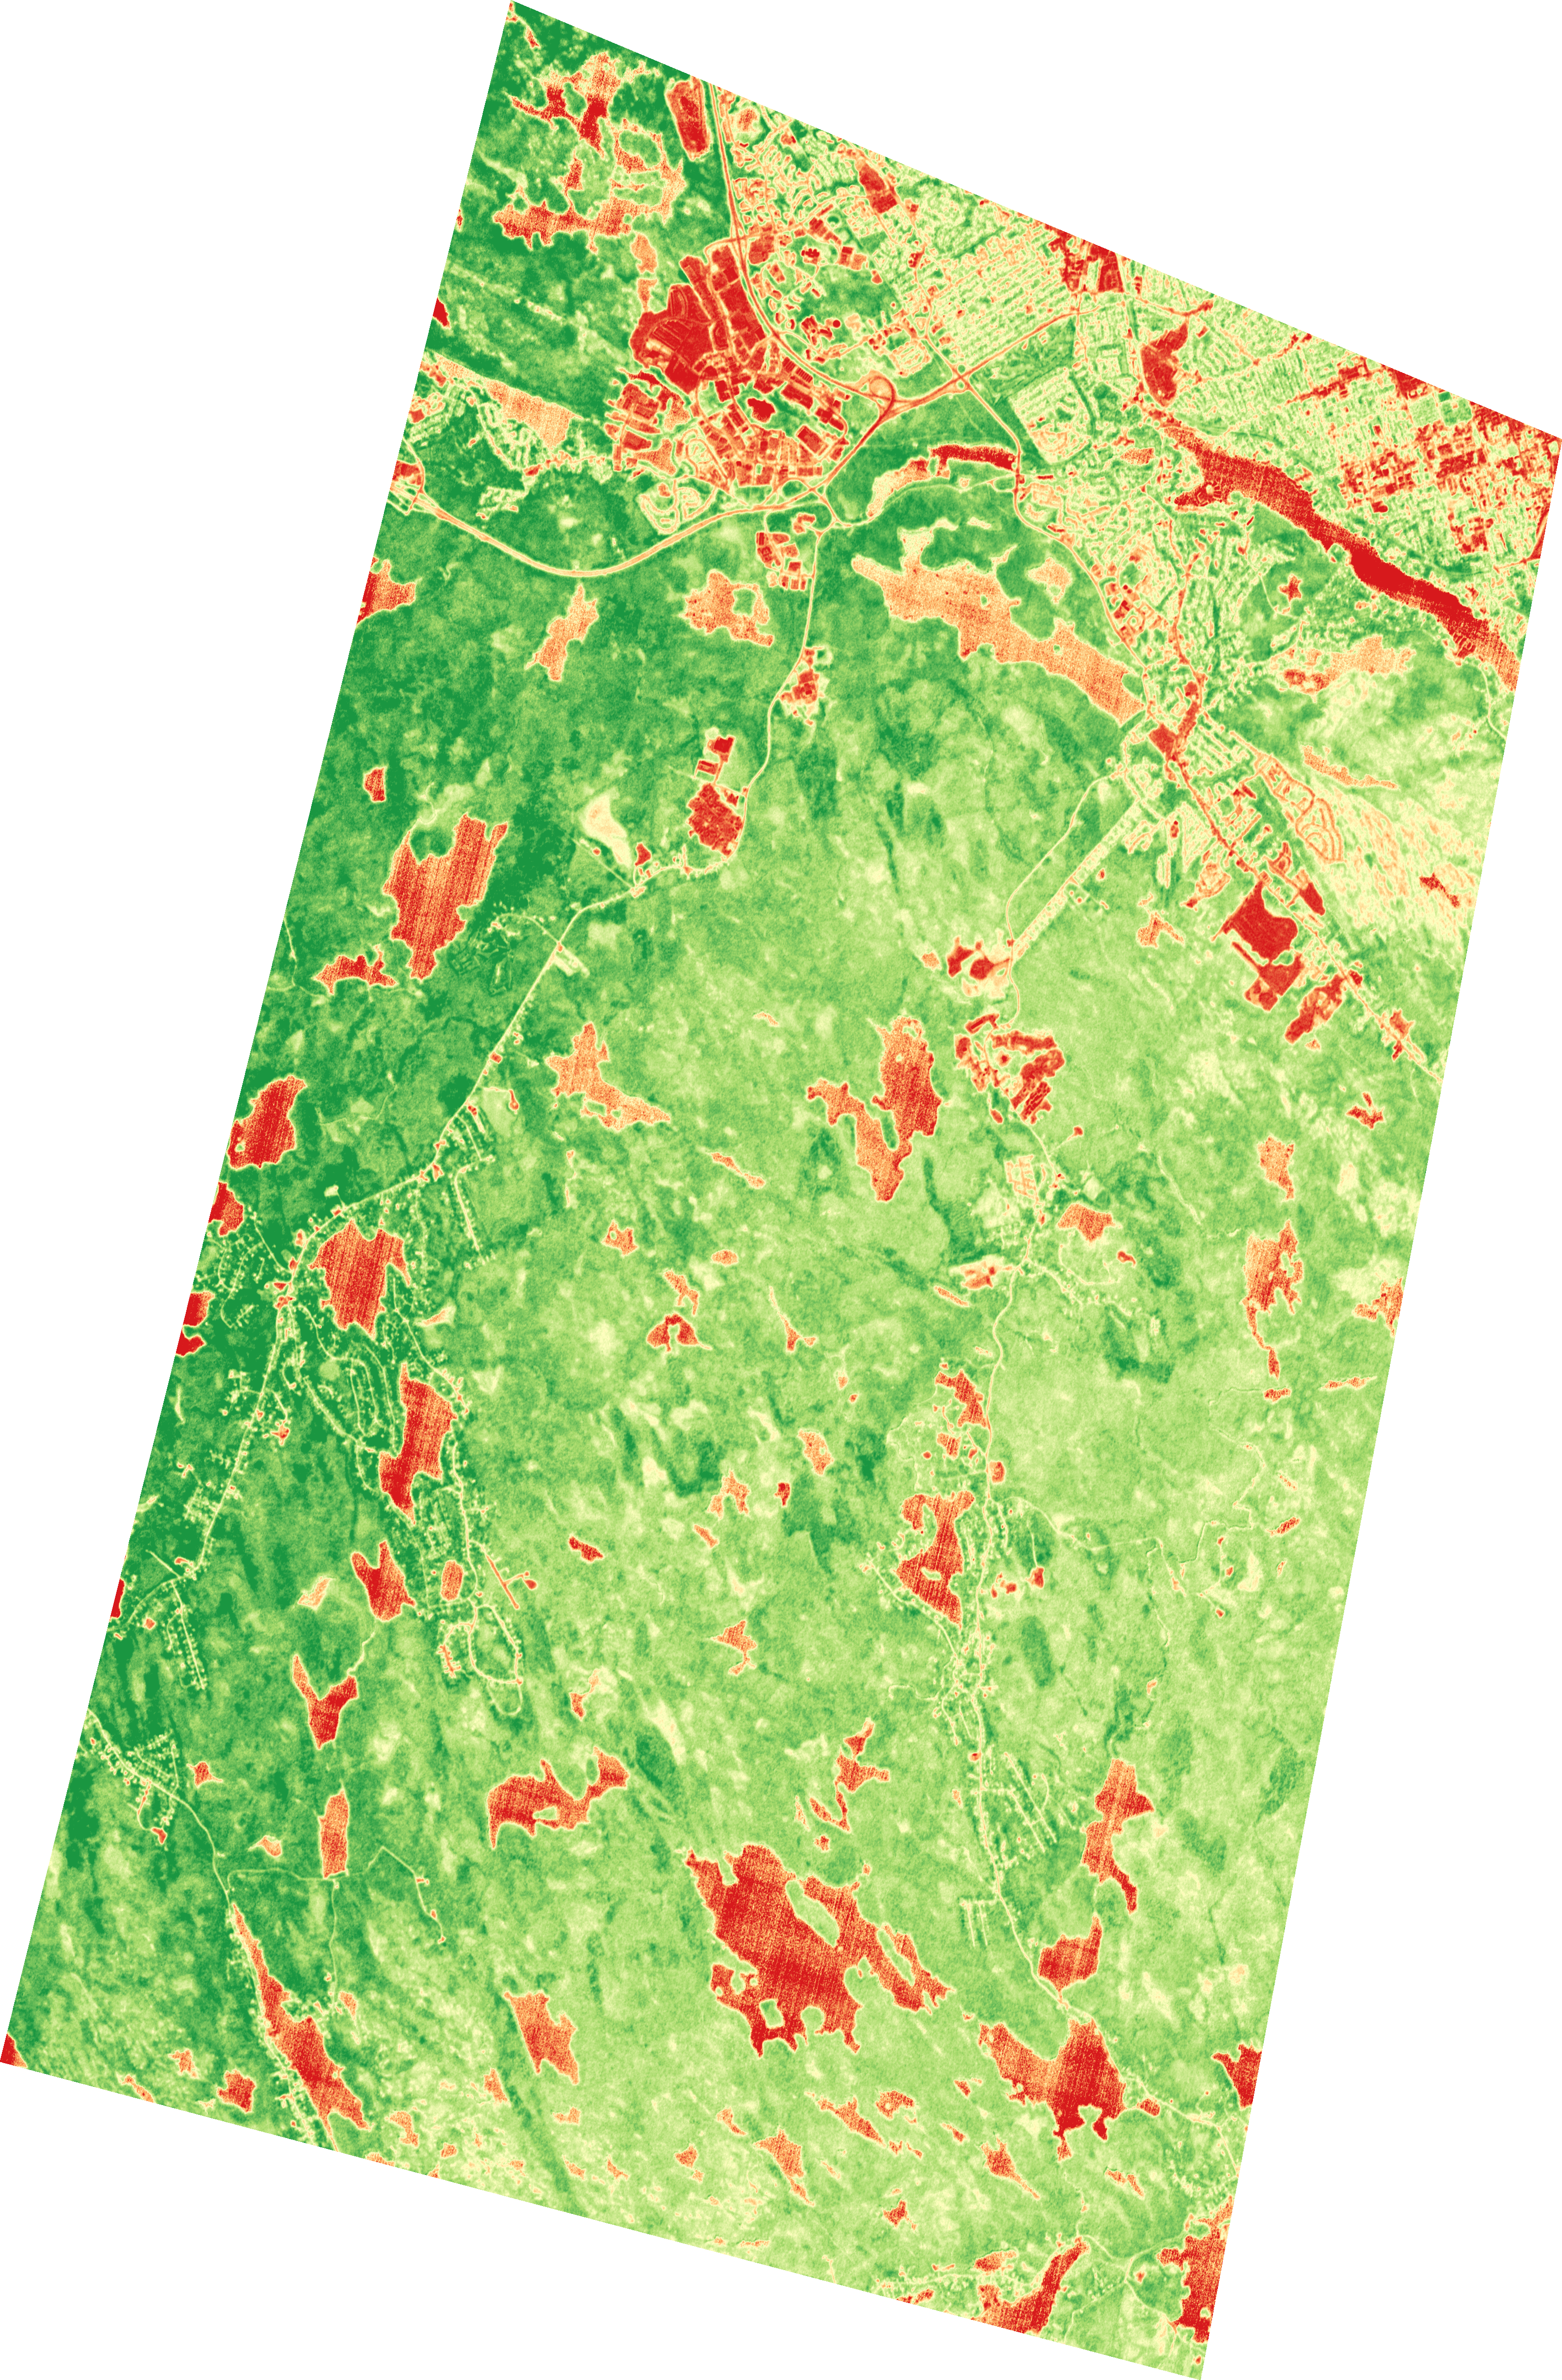
Wilderness area south of Halifax, Canada: Natural colour vs. RENDVI
Before begining
This tutorial assumes the following steps have already been taken:
- QGIS has been downloaded and installed on your machine. Visit qgis.org to download QGIS.
- You have loaded a Wyvern image into QGIS, feel free the explore the open data program for one that interests you.
- We will be using this image over southern Halifax, Canada for this tutorial.
QGIS provides a nice user interface for many workflows GIS analysts will need. One of the most common workflows when working with satellite imagery is creating indices.
Calculating an index in QGIS is as simple as using the built in raster calculator to compute pixel values using selected bands based on the index you want to produce!
Indices
Data scientists and analysts create indices from satellite imagery to simplify complex spectral data into clear, interpretable measures of surface conditions. Indices such as the Red Edge Normalized Difference Vegetation Index (RENDVI) combine multiple spectral bands to reveal patterns in vegetation health that are not obvious in raw imagery. This simplification improves comparability across space and time and supports efficient large-scale monitoring and analysis.
For this tutorial we will compute the RENDVI over a wilderness area south of Halifax on the east coast of Canada. RENDVI is just one of many index calculations enabled by hyperspectral data, we have tons of examples of indices available for you to explore at our hyperspectral library.
The Workflow
To start, we will open our Dragonette data in QGIS and lightly style it to give us a natural color composite.
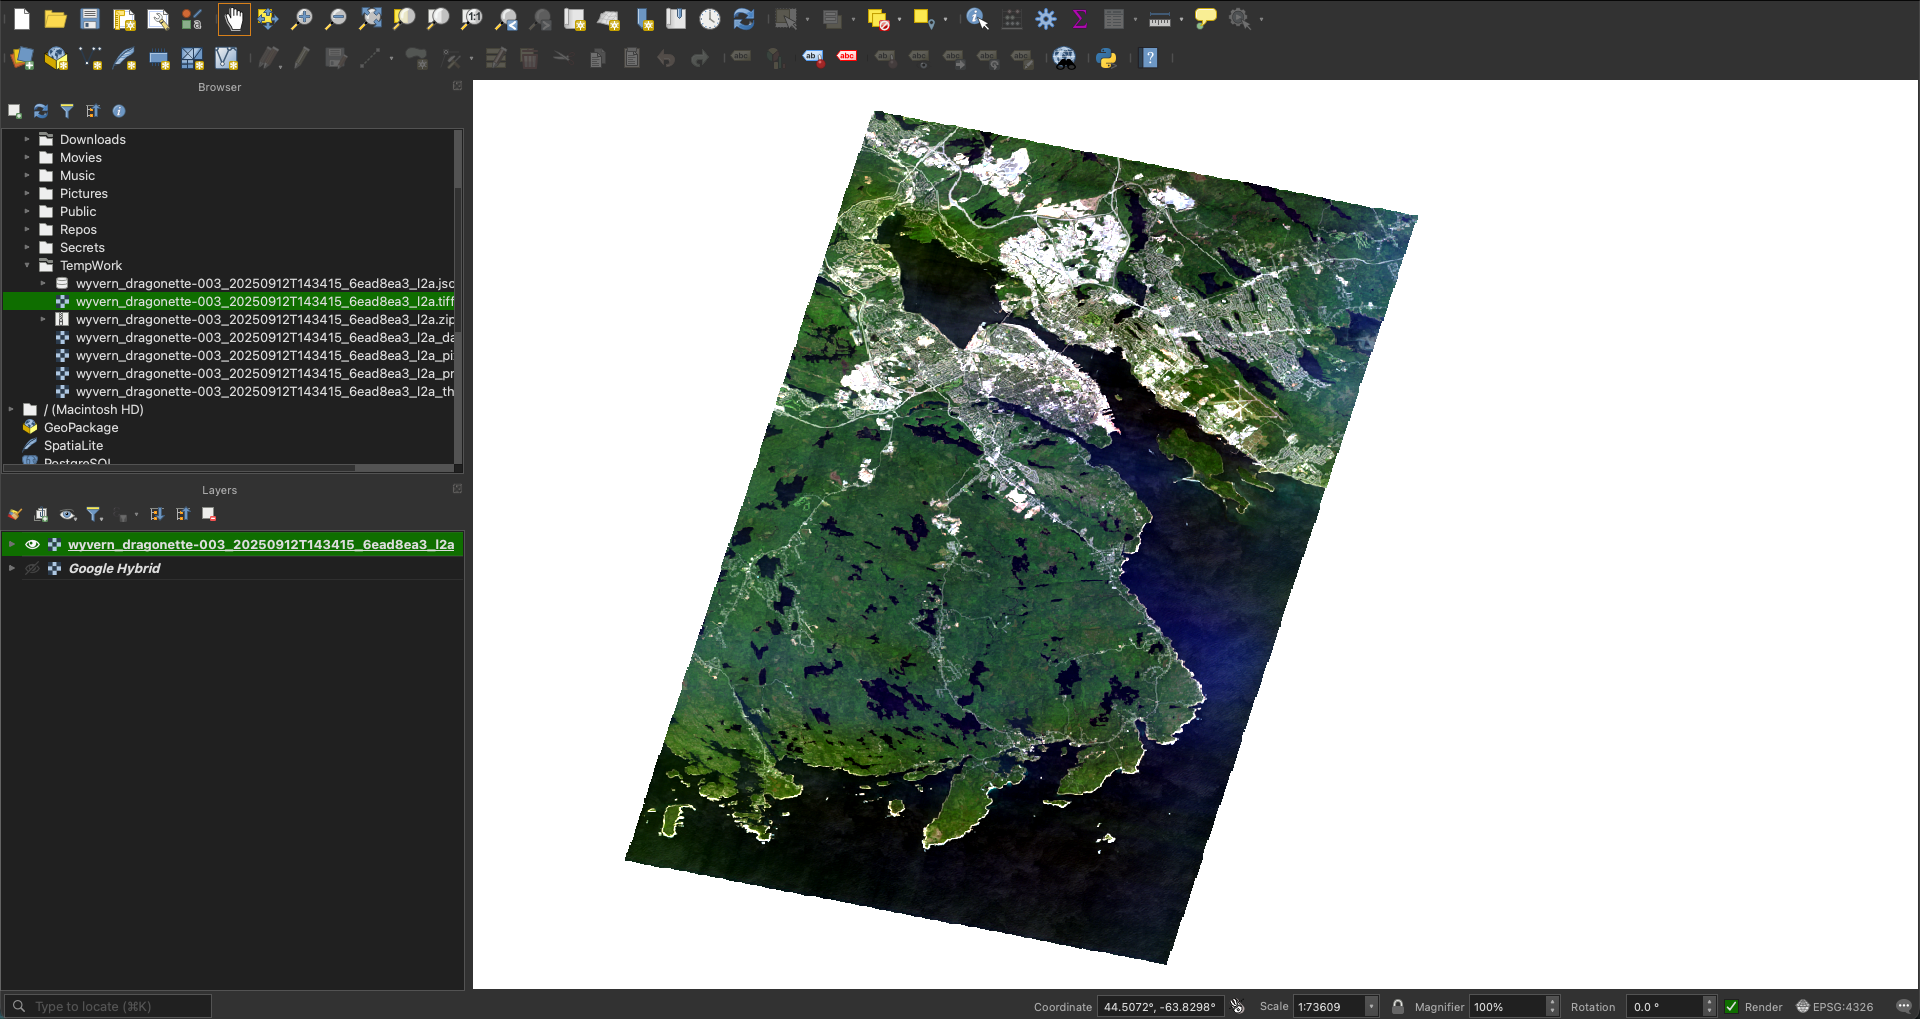
Natural color composite of wilderness area south of Halifax (Bands: 11, 5, 1)
If you are having trouble loading in or creating an RGB image,
please follow the steps provided in this tutorial.
Depending on your machine, it may make sense to clip the image to save on memory.
Now that we have our image loaded in, we can calculate our RENDVI.
RENDVI is a fairly simple index calculated using two red bands, one at 750nm () and the other at 710nm ().
Red Edge Normalized Difference Vegetation Index (RENDVI) Equation
We can refer to our hyperspectral library and see that we should use Band 24 for our band
and Band 21 for our band.
Translating this to QGIS means opening the Raster Calculator (Raster -> Raster Calculator).
We then see Dragonette-003's 31 bands that we can choose from.
All we have to do now is plug in our Band 24 as the and our Band 21 as the !
The formula in your raster calculator should look something like this:
("wyvern_dragonette-003_20250912T143415_6ead8ea3_l2a@24" - "wyvern_dragonette-003_20250912T143415_6ead8ea3_l2a@21")
 / ("wyvern_dragonette-003_20250912T143415_6ead8ea3_l2a@24" + "wyvern_dragonette-003_20250912T143415_6ead8ea3_l2a@21")
Next just name our Output layer something sensible, choose your prefered Output format (GeoTIFF works well), and click ok!
Raster Calculator will run that formula on each pixel in our image, and create a new raster with values ranging from -1 to 1.
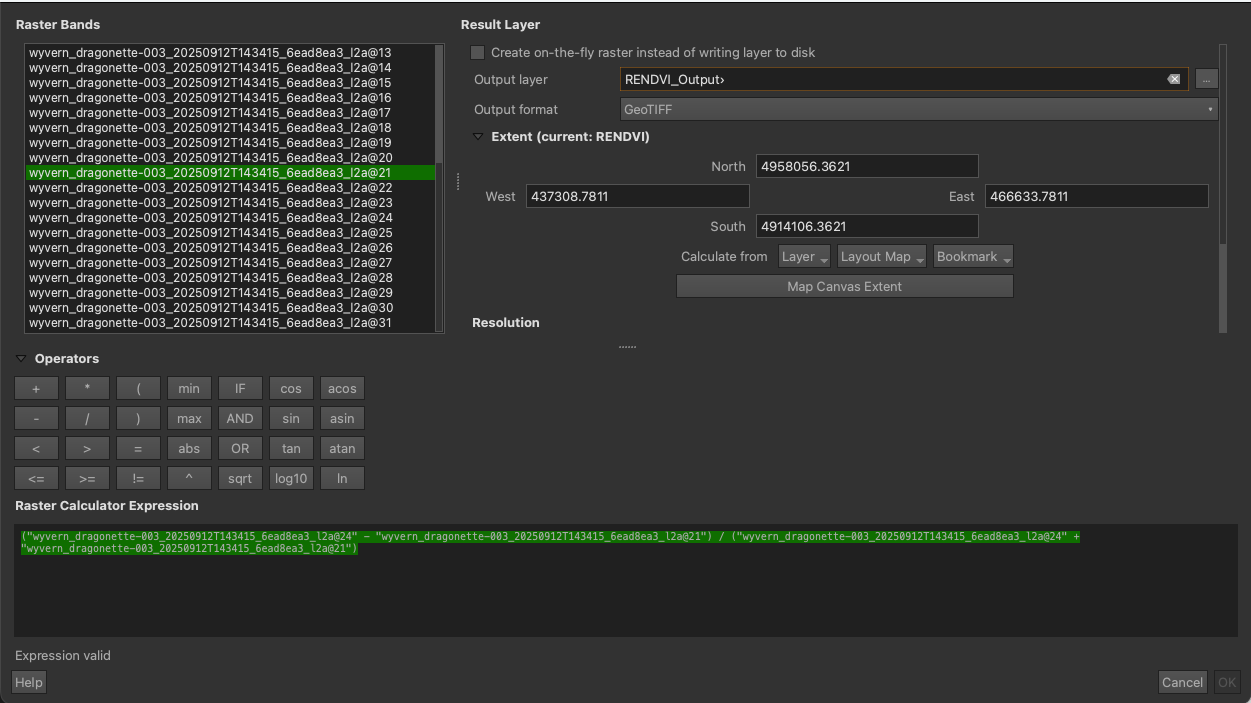
Raster Calculator with RENDVI calculation plugged in
Now we have our RENDVI raster calculated and displayed in our workspace! We can apply some symbology to our layer to be more consistent with typical RENDVI visualizations. To do so:
- Double click the newly created raster in the
layerspanel. - In the
symbologytab, change theRender typetoSingleband pseudocolor. - Here we will choose our color ramp, RENDVI typically uses a red-yellow-green color ramp.
- You can find this by clicking the down arrow on the right of
Color Ramp Color ramp -> All Color Ramps -> RdYlGn
- You can find this by clicking the down arrow on the right of
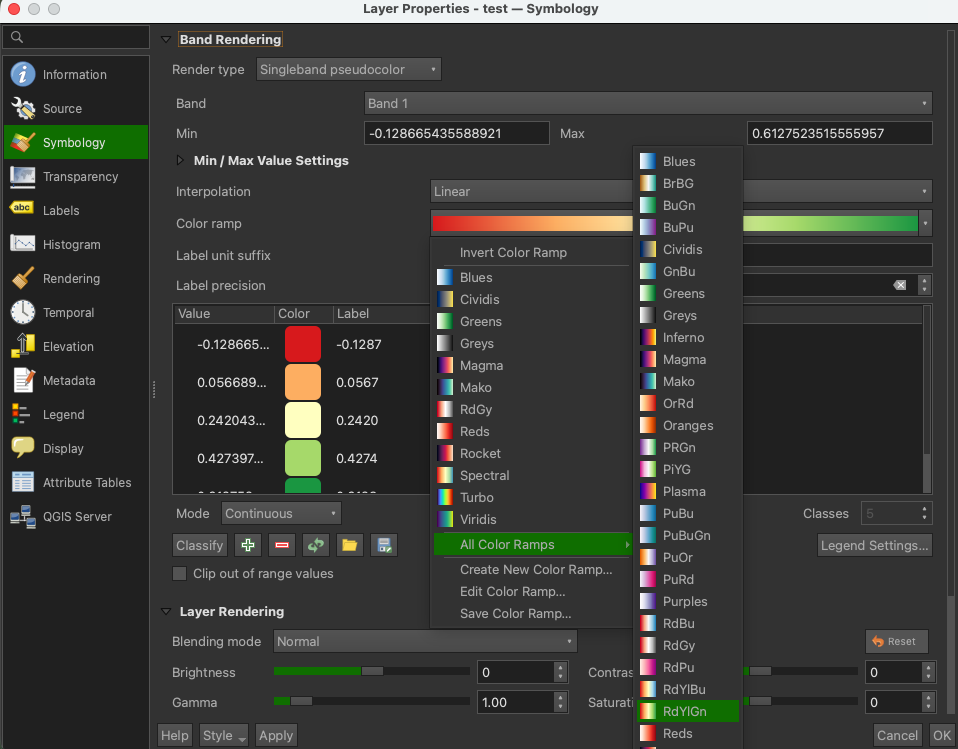
Applying symbology to our RENDVI layer
You can determine your own min/max cutoffs for styling by computing a histogram of the raster values by going to
Histogram -> Compute Histogram.
We will use Min: 0, Max: 0.4 for our RENDVI visualization.
Voila! You have now created an RENDVI layer out of Wyvern's hyperspectral data! You'll notice areas that pixels containing any water or synthetic materials in the image will appear red, while healthier vegetation will appear darker green.
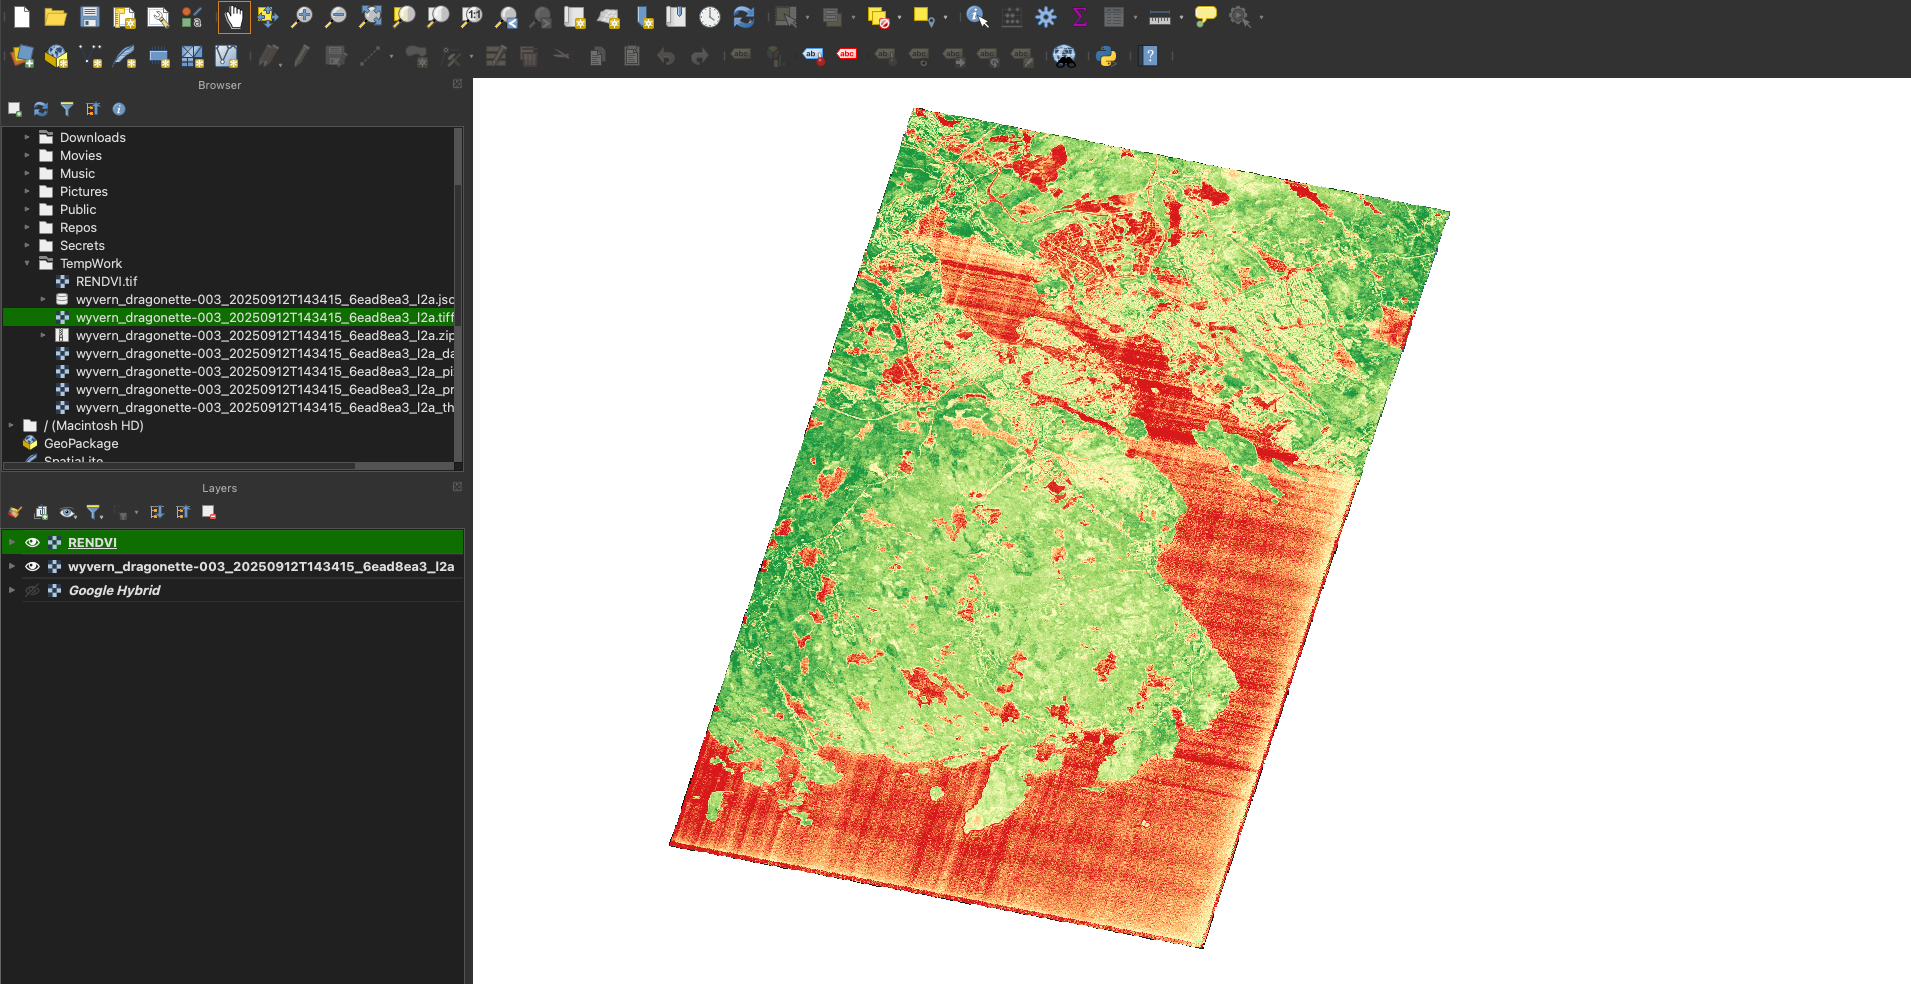
Stylized RENDVI output layer
Now that you know how to translate formulas for hyperspectral indices into QGIS's raster calculator, we implore you to explore other images in our open data program and apply other indices from our hyperspectral library.
Hyperspectral enables more precise index calculation, allowing for better data for scientists, policy makers, and you. Unlock the full story hidden in the spectrum and start exploring what’s possible.