Loading Data in ArcGIS Pro
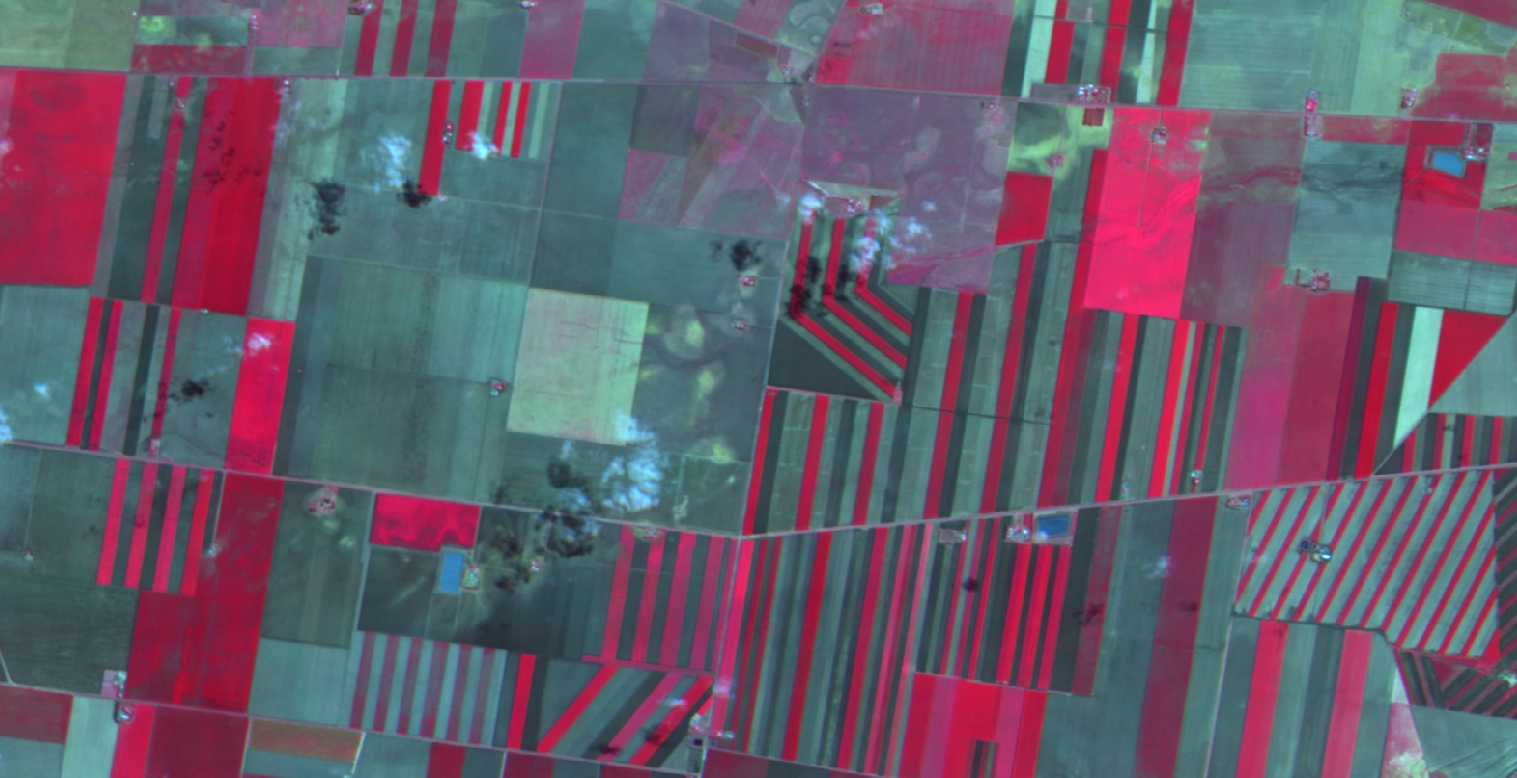
Final output of this tutorial
Before you start...
Before starting this tutorial, please ensure you have done the following:
- ArcGIS Pro has been downloaded installed on your machine. Visit pro.arcgis.com to download ArcGIS Pro.
- You have a Wyvern image you can load into ArcGIS Pro. If you haven't downloaded one already, we'll be using this image for the next steps.
In this tutorial, there will be references to the Ribbon. This is the primary interface for working with ArcGIS Pro.
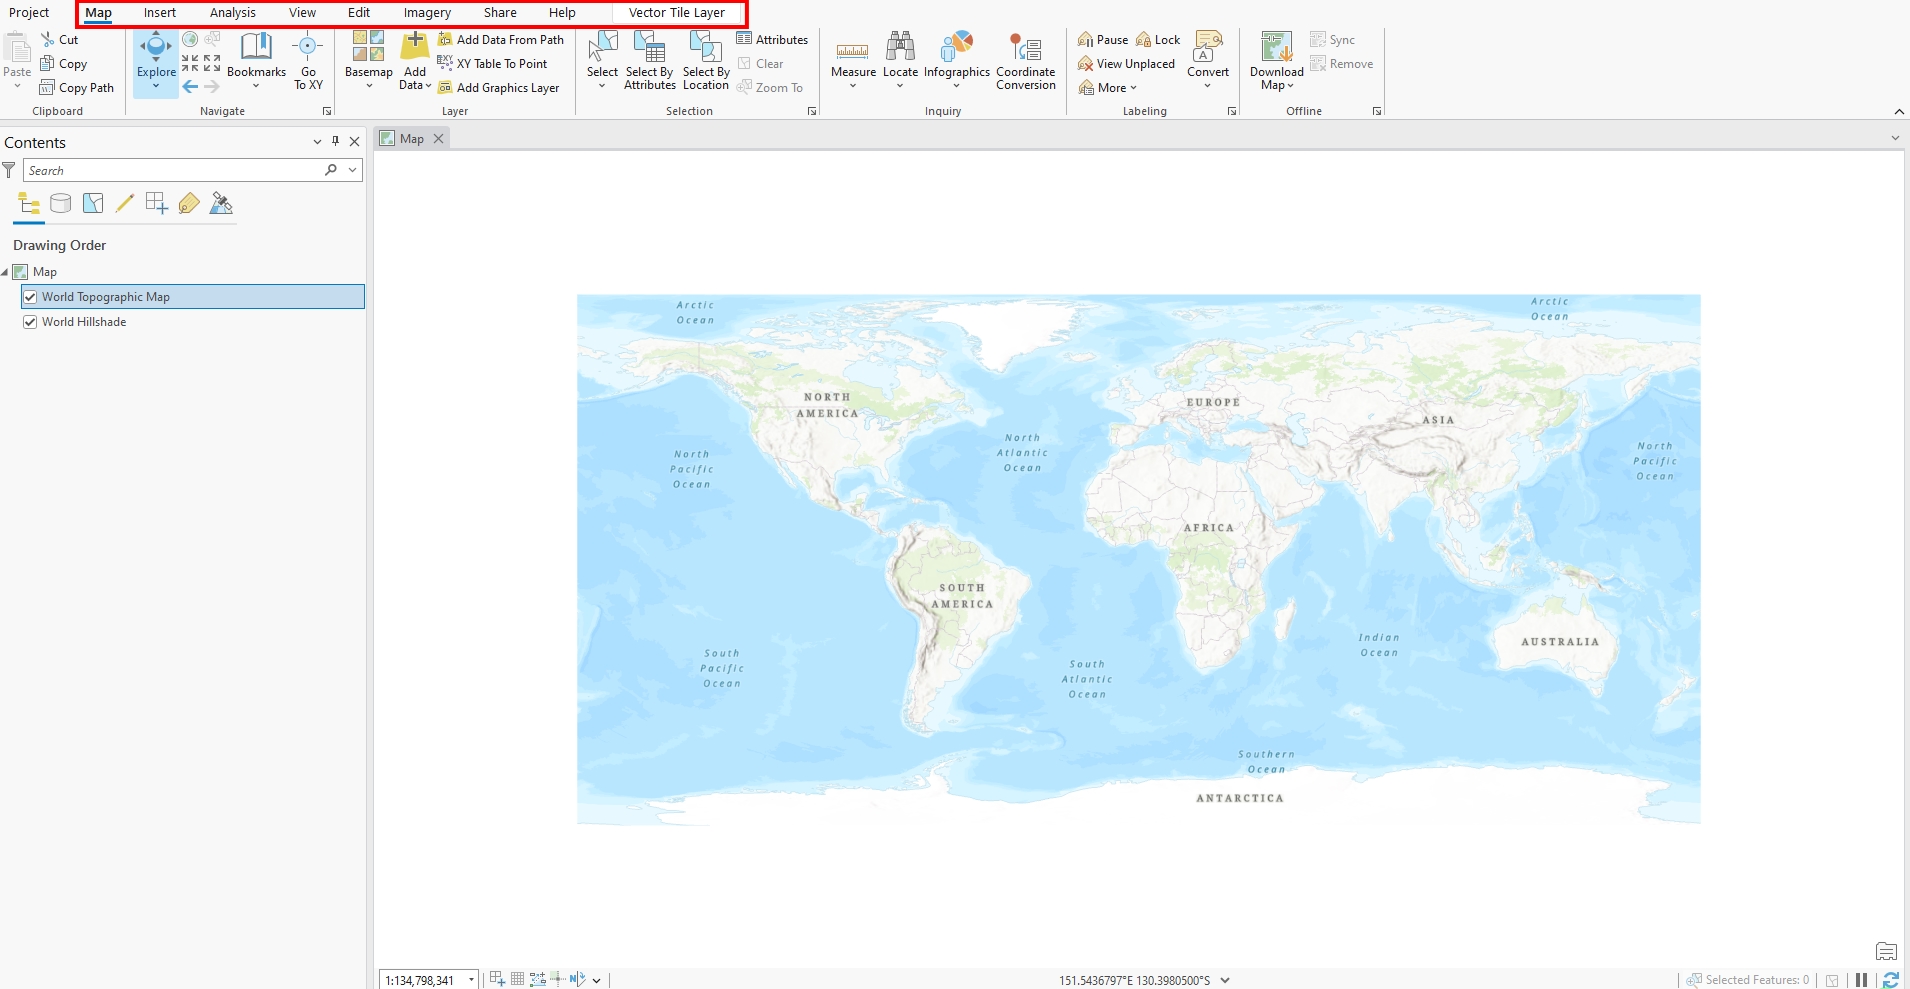
ArcGIS Ribbon
Starting a new ArcGIS Pro Project
Before opening the Wyvern image, an ArcGIS Project should be created:
- Open ArcGIS Pro.
- Click
New Project->Map. - Name your project and chose a location for saved files on your computer.
ArcGIS Pro will now be open with the basemaps World Topographic Map and World Hillshade.
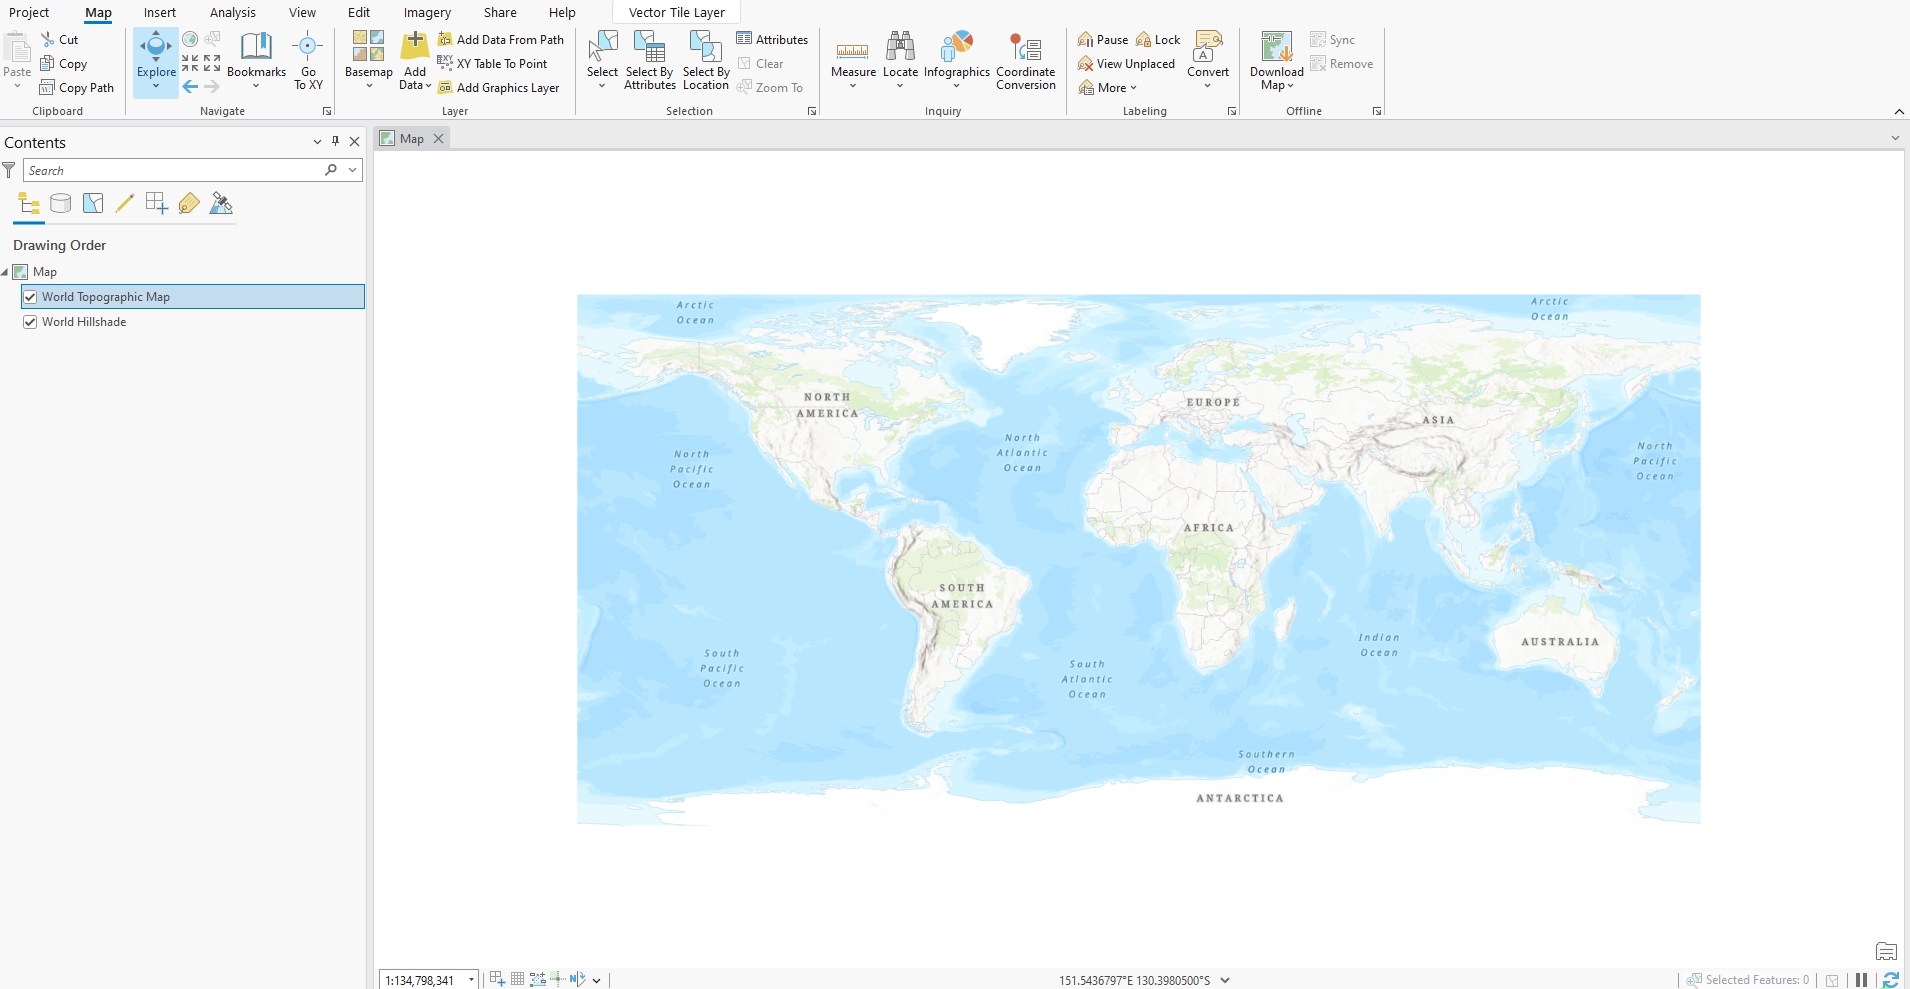
Empty ArcGIS Pro Project
Loading Data into ArcGIS Pro
To load an image into ArcGIS, you have a number of different options:
- Using the
Add Datatool.Ribbon->Map->Add Data->Browse-> Navigate to and select the Wyvern GeoTIFF file ->Click OK.
- From your file explorer.
- Drag-and-drop the GeoTIFF file into the ArcGIS Pro main window.
- Depending on your ArcGIS settings, you may be prompted to
Calculate Statistics. This option calculates image statistics which will allow ArcGIS to more quickly read and display the image. It will take some time to calculate once but will be faster in the long run!
Congrats! You have successfully loaded an image into ArcGIS Pro. ArcGIS will automatically read wavelength information about the Dragonette image. This means it will automatically load the correct bands for an natural color RGB!
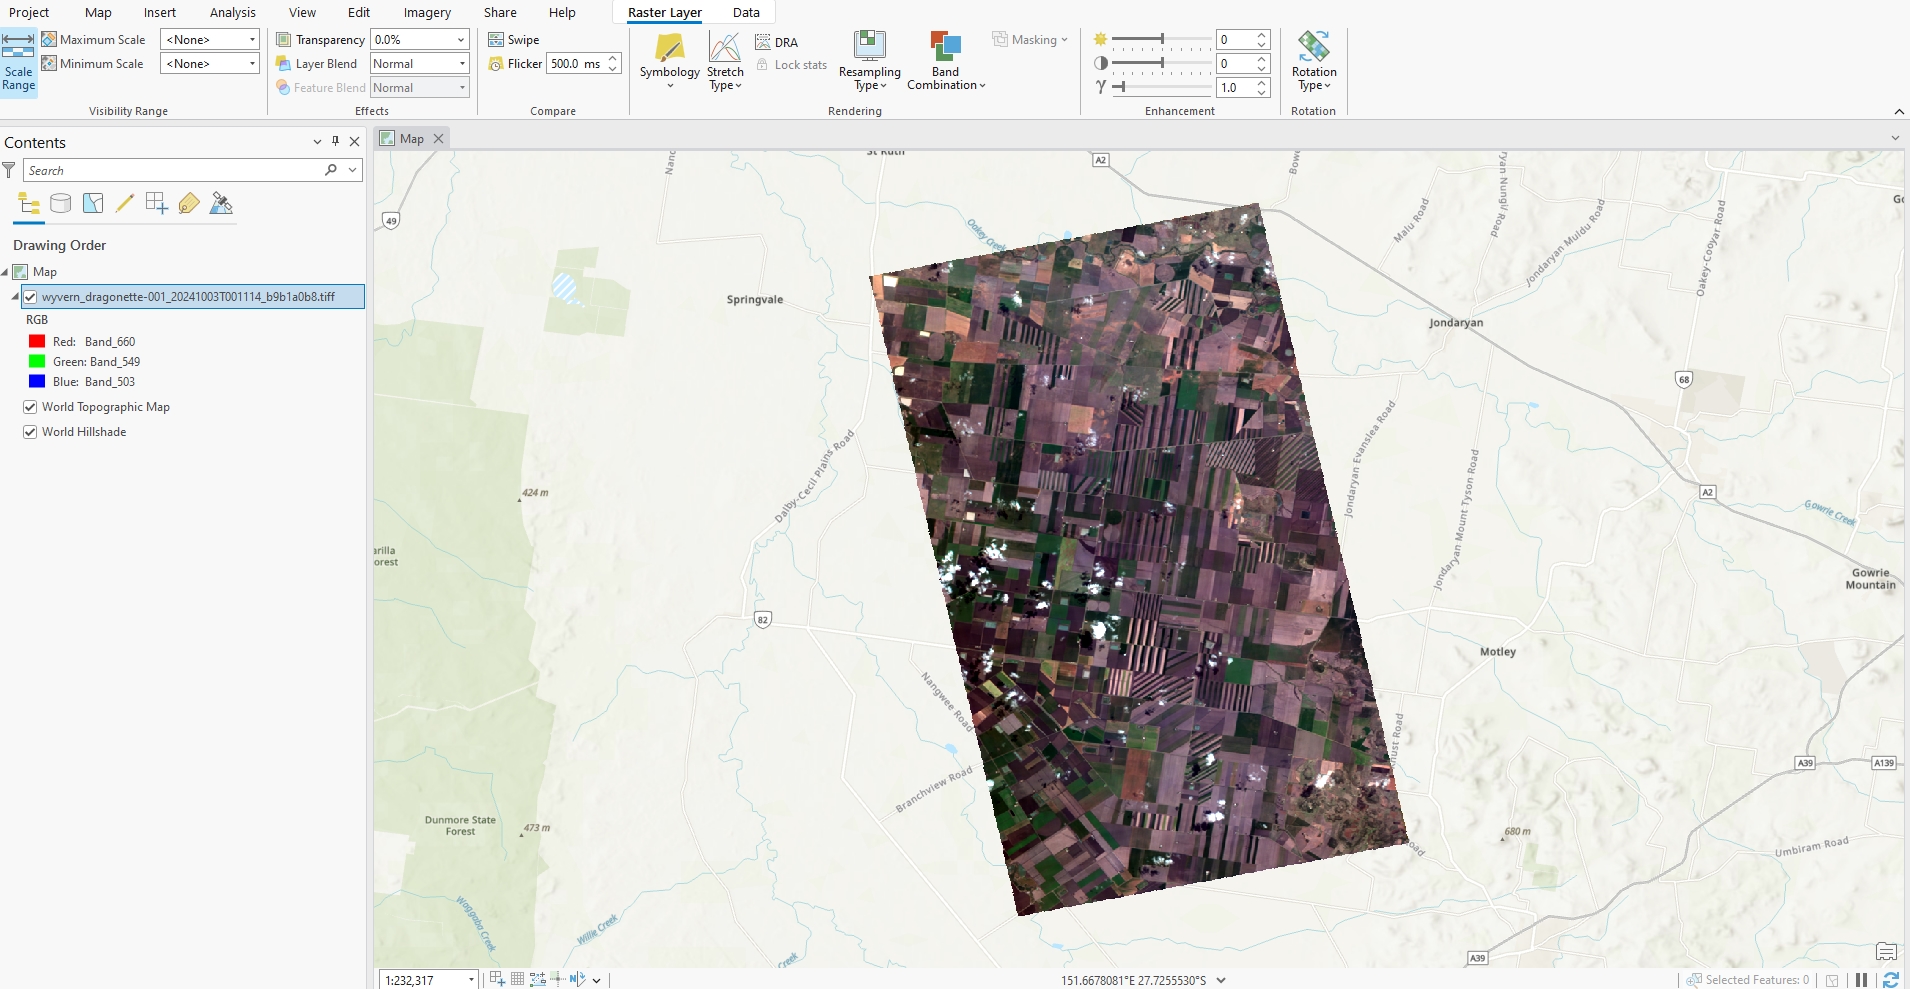
Wyvern GeoTIFF rendered in ArcGIS Pro
Now, to see more detail, let's zoom into an area we're interested in using the scroll wheel or zoom tools.
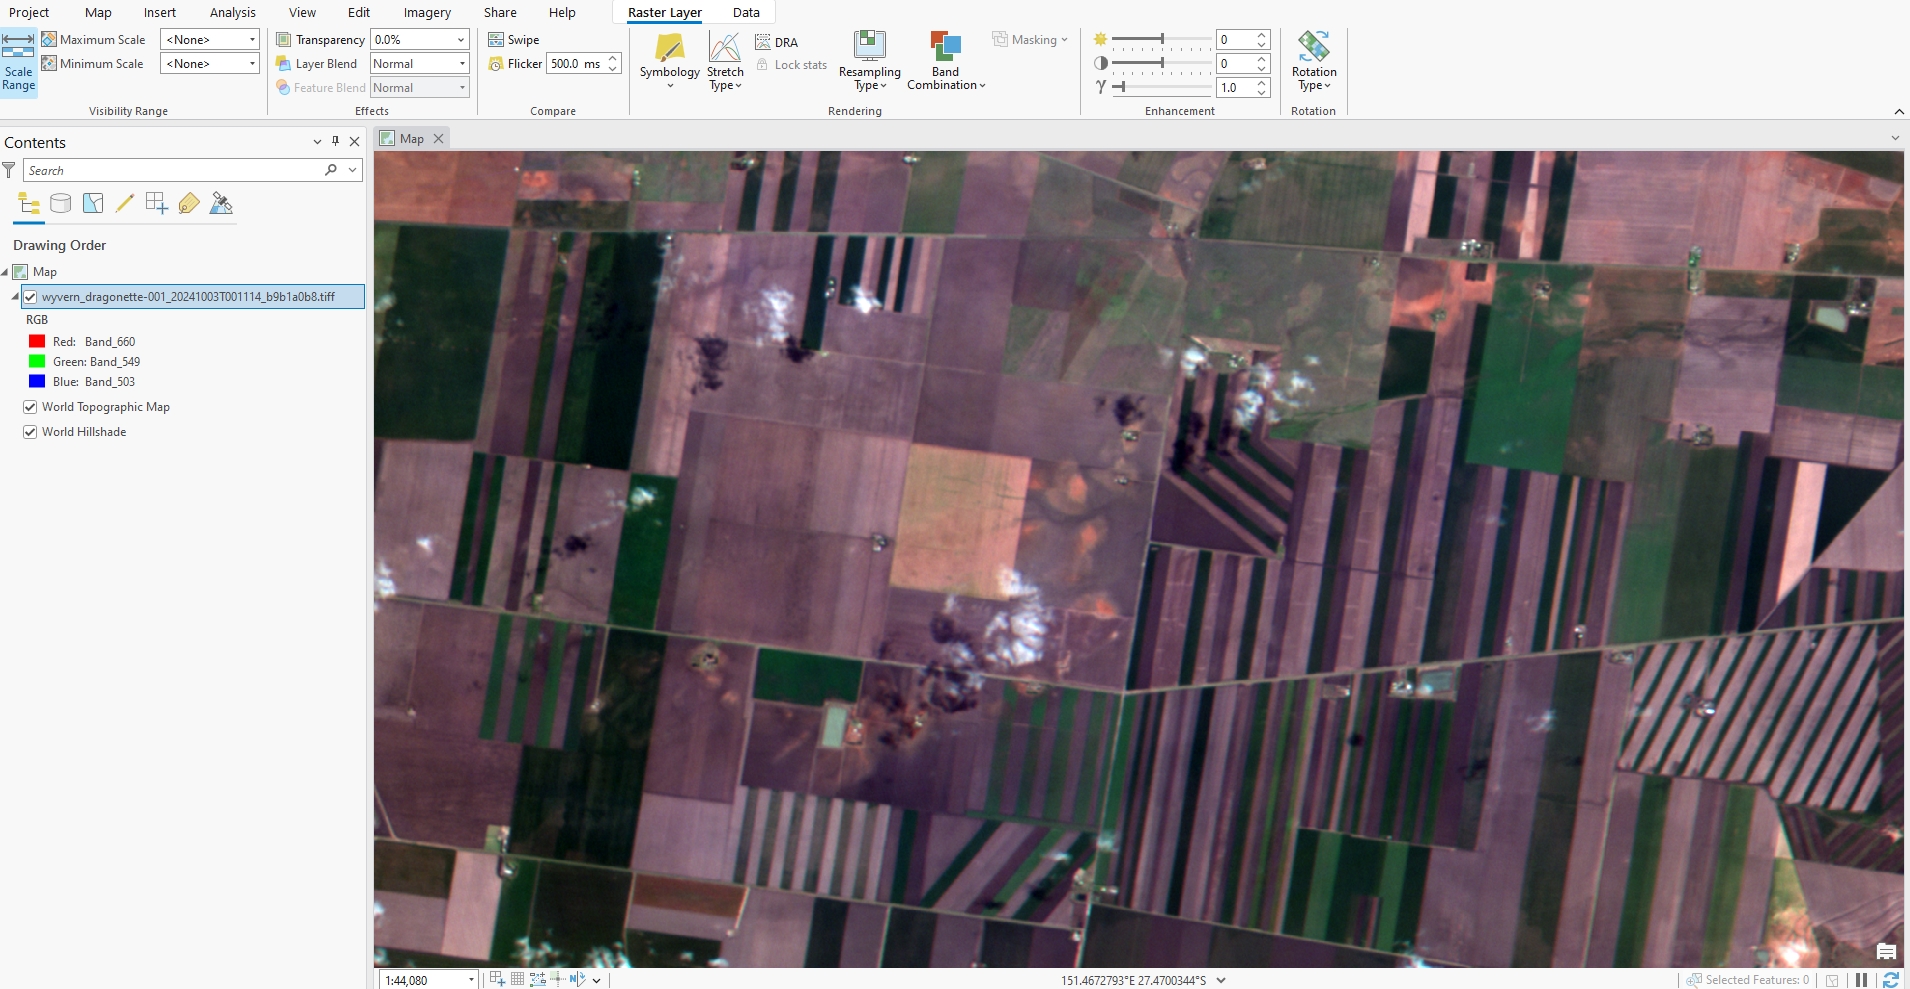
Zoom of Wyvern hyperspectral data natural color
Band Combinations
Since ArcGIS automatically reads Wyvern's band information, it can also quickly change between natural color and color infrared band combinations!
Below is a list of bands that ArcGIS will use for visualizations.
| Name | Description | Red Band | Green Band | Blue Band |
|---|---|---|---|---|
| Natural Color (RGB) | Normal visualization | 660nm | 549nm | 503nm |
| Color Infrared | Vegetation analysis | 799nm | 660nm | 549nm |
To change the band combinations to color infrared, first select the Wyvern image in the Contents Pane to the left of the map. Then click
Ribbon -> Raster Layer -> Band Combination -> Color Infrared.
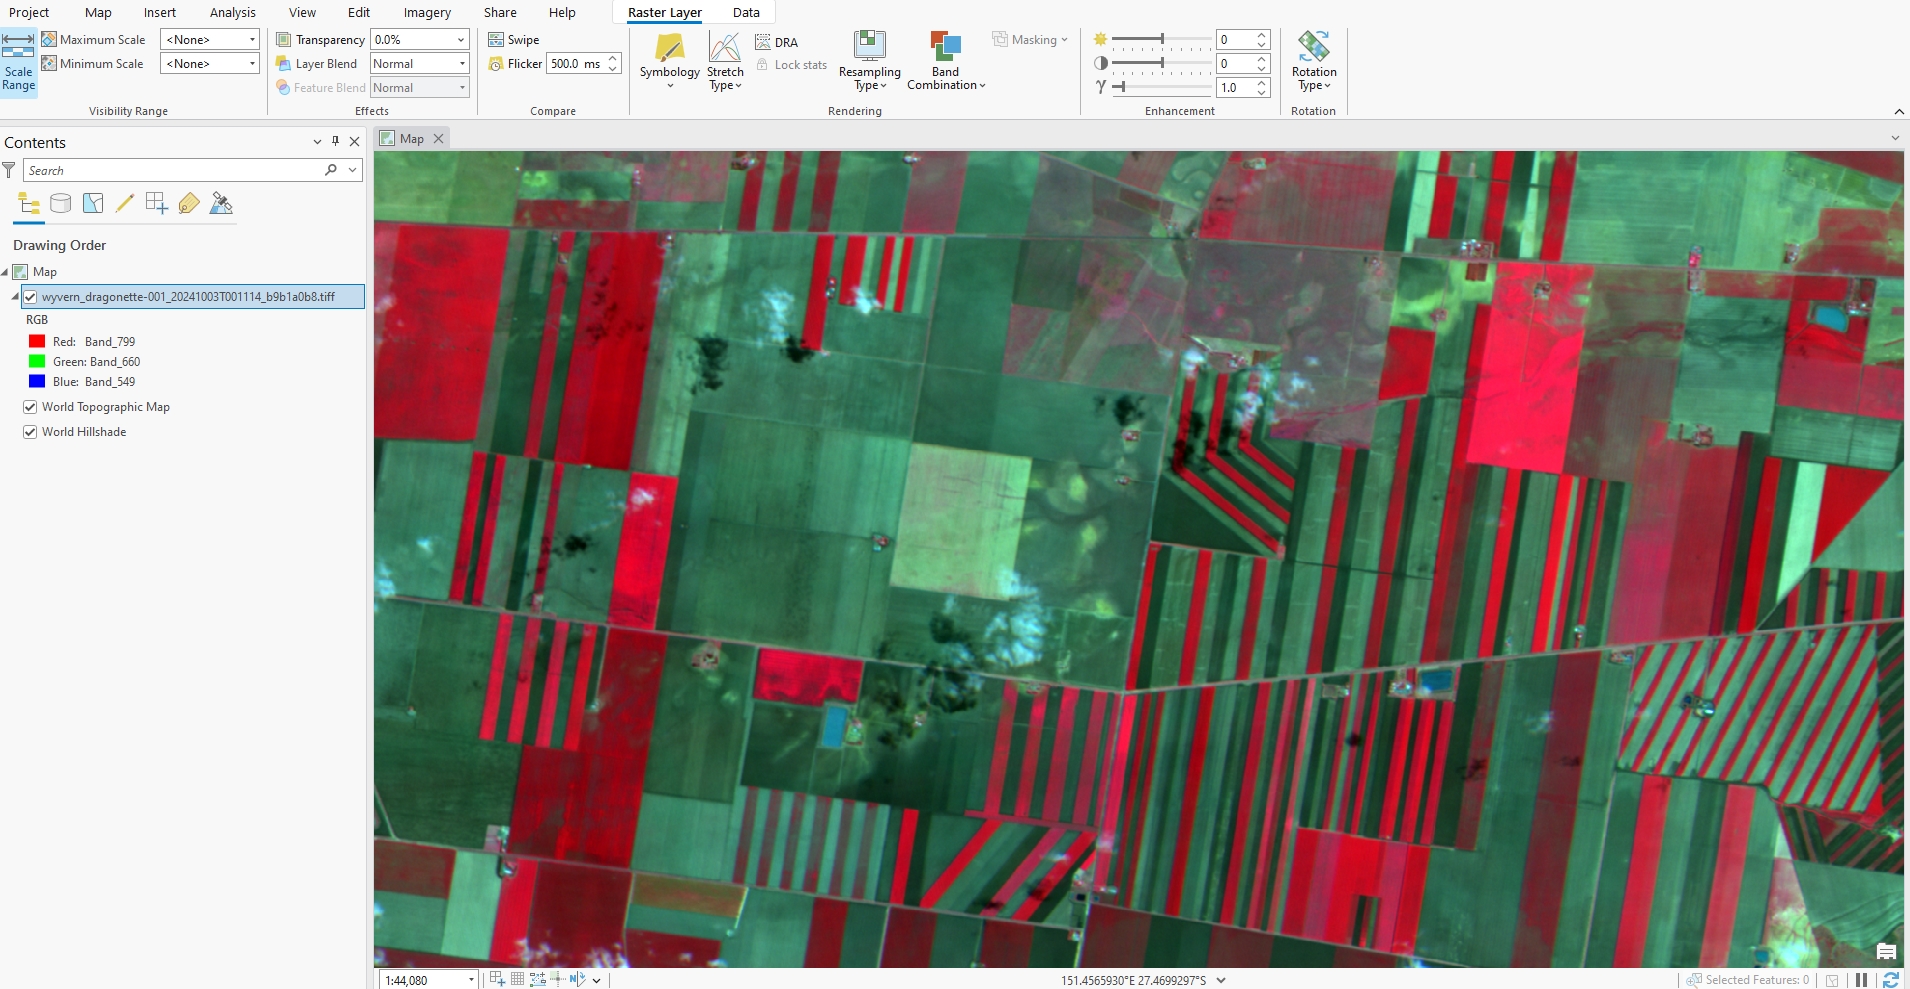
Color Infrared Image
Adjusting Stretch
Every image is slightly different in its lighting conditions and distribution of values within each band. ArcGIS has default stretch settings that work alright for most images, but definitely benefit from careful adjustment.
To change the stretch, select the image layer in the Contents Pane to the left of the map. Then right-click the image layer ->
Symbology. The symbology pane will open to the right of the map.
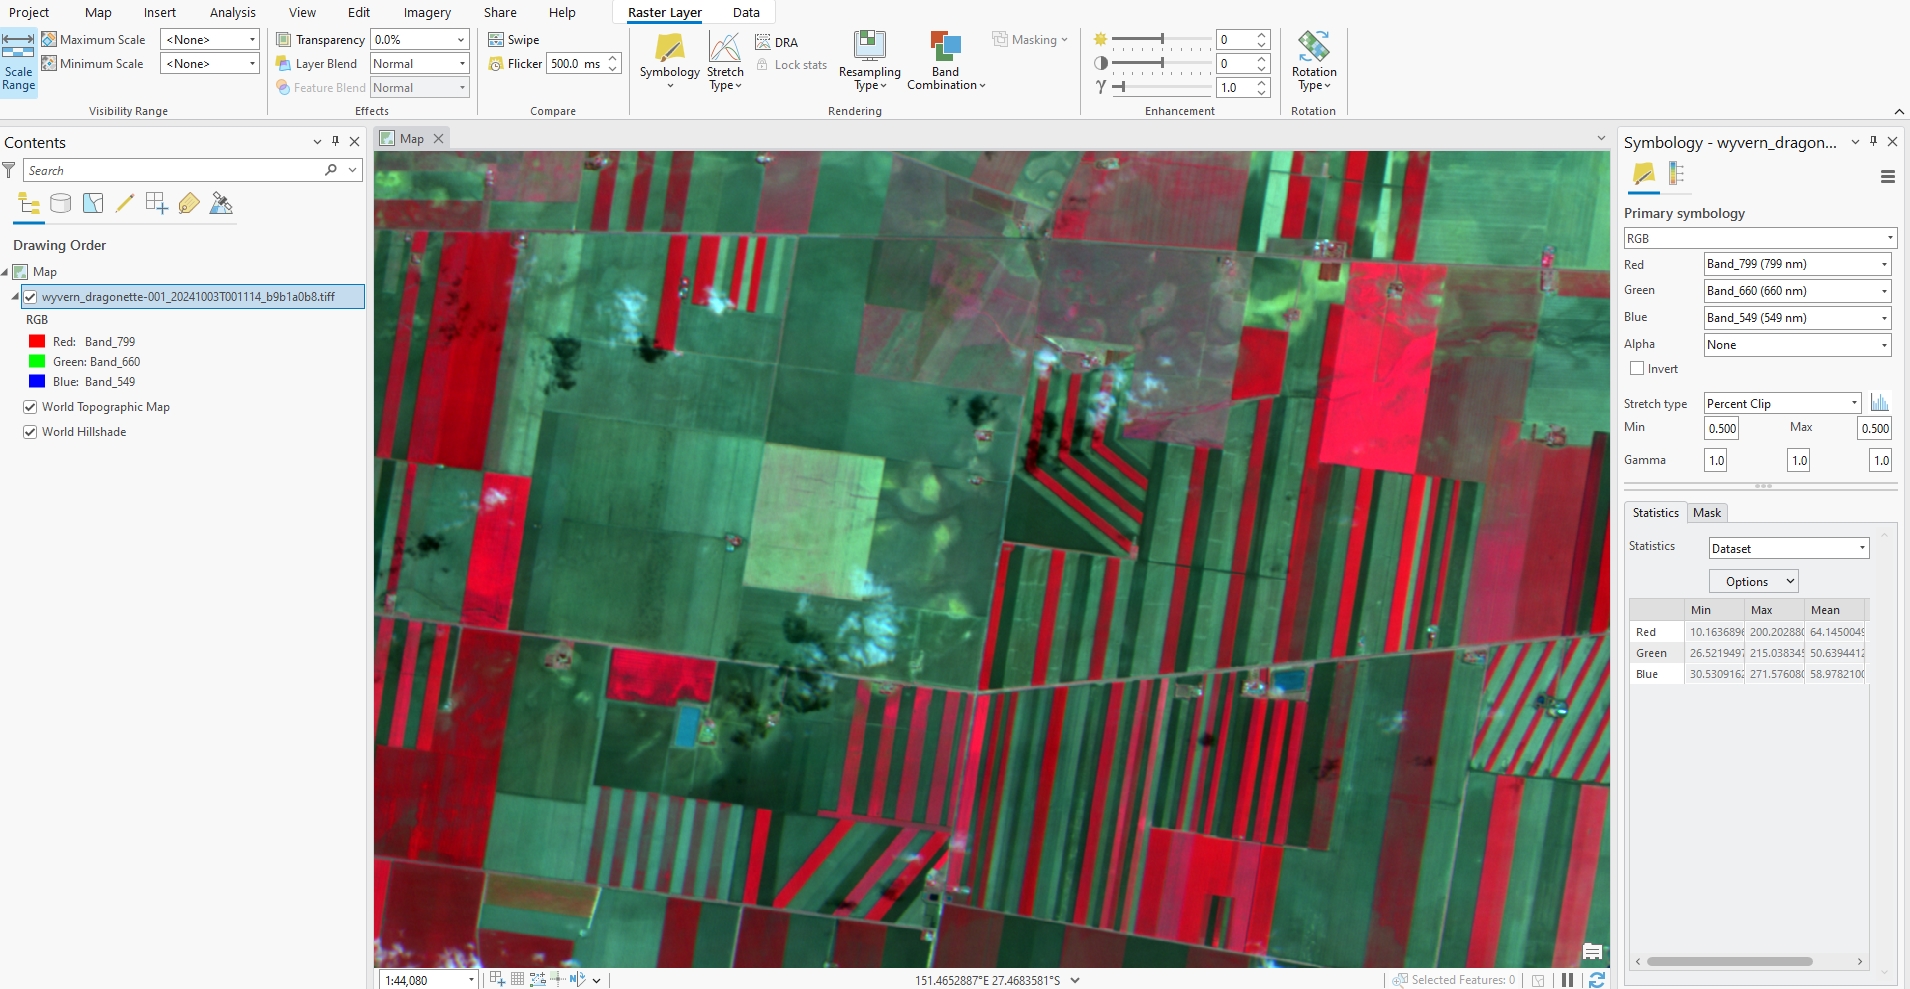
Opening the Symbology Pane
In this case, the Stretch type is set to Percent Clip.
To easily adjust the stretch, change Stretch type to Standard Deviation. This will default the Number of standard deviations to 2. This value can be changed to increase or decrease the difference between bright and dark pixels.
Stretch standard deviation 2
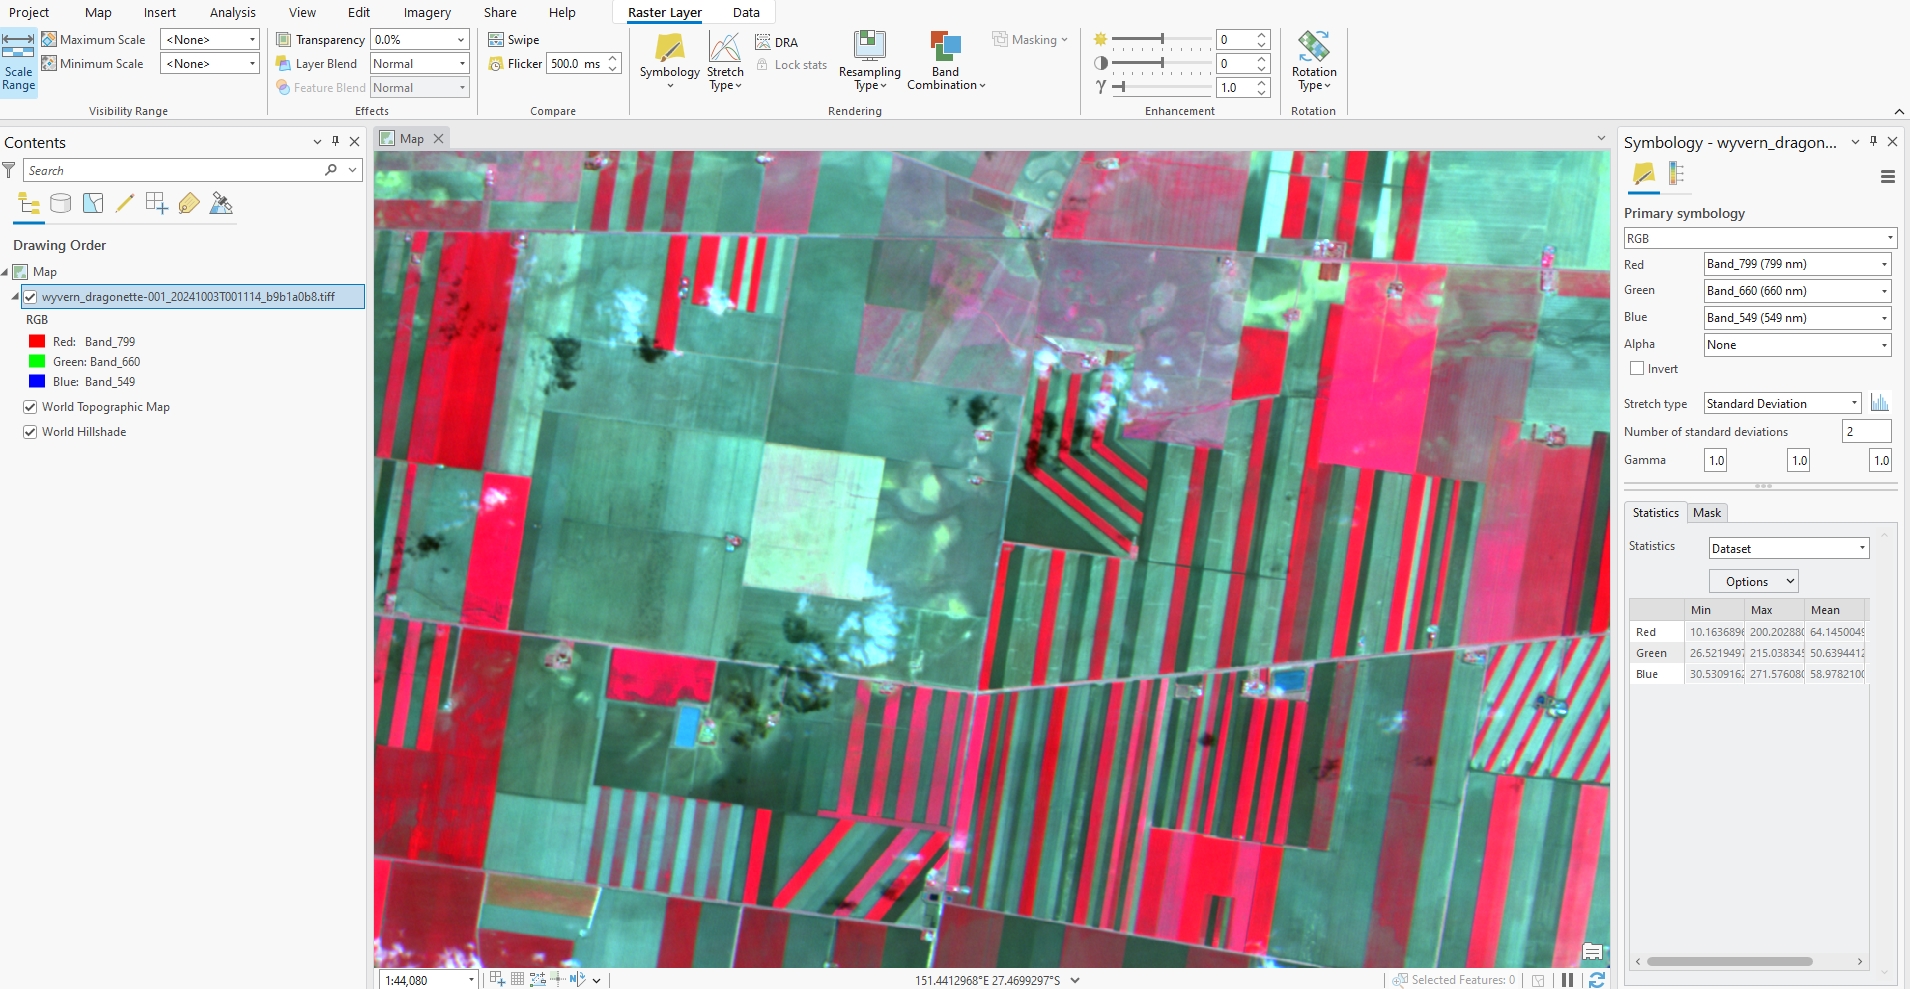
In this image, the bright clouds are affecting the image stretch saturating some of the ground features. To see more detail in these saturated ares, let's set the Number of standard deviations to 4.
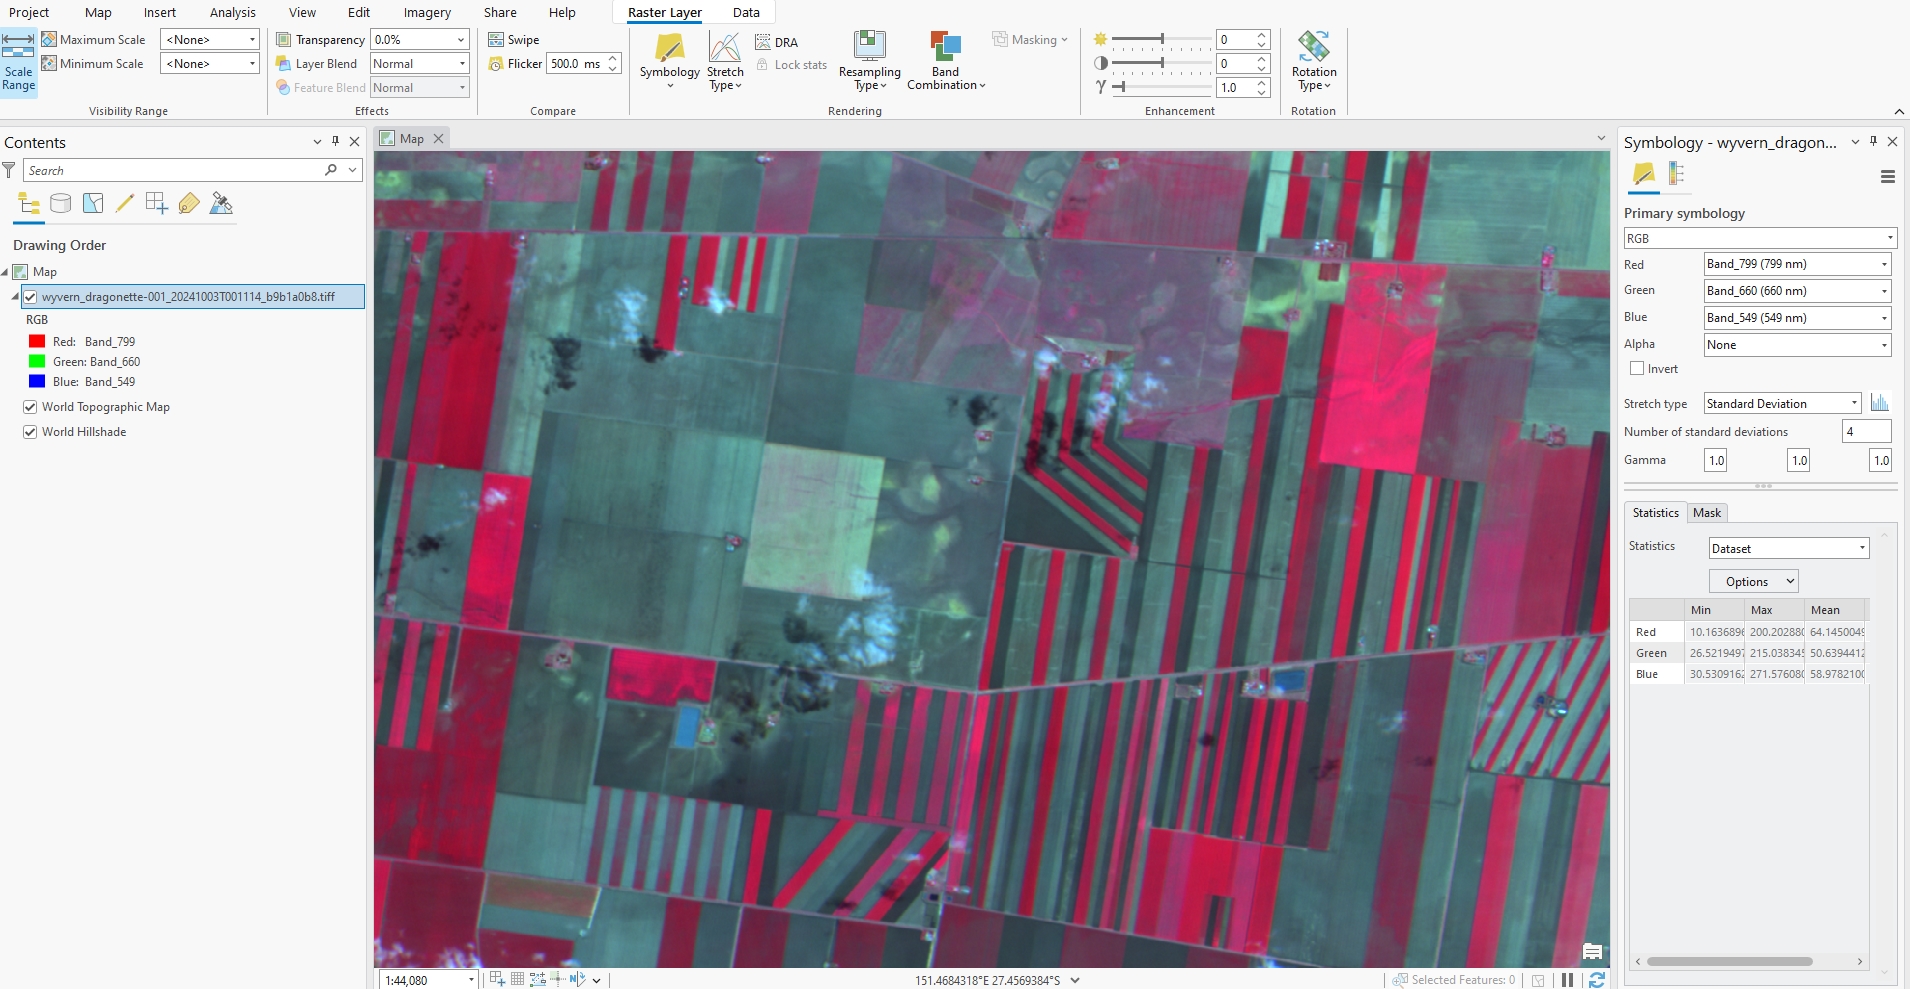
Stretch standard deviation 4
Now you can see detail in some of the fields that were previously saturated.
From the symbology pane, different stretch types and band combinations can be used to view Wyvern's hyperspectral data in different ways!