Index Calculations with Python
It still has useful information, but will be replaced soon.
Calculating indices like NDVI or NDWI is an extremely common task in geospatial analysis. Many tools like QGIS provide a user-friendly interface for calculating indices, however with Python we have to do more of the hard work ourselves!
Index calculations, in their simplest form, is just math applied to arrays of numbers (raster images!). There are a number of tools available in Python for working with arrays, and we'll cover the most popular (Numpy) here.
Numpy
Numpy is fantastic at array calculations, however Numpy is incapable of reading our raster files into arrays. For this, we'll use Rasterio (which relies on GDAL), however there are a number of Python packages that don't have a GDAL dependency that can also be used.
First, we'll read our array into Numpy using Rasterio.
import rasterio

FILE_PATH = "/vsis3/wyvern-drone-data-processed/processed/SFB1516/WYVERN_SFB1516_20220726_v0_1_0_5mGSD.tiff"

file = rasterio.open(FILE_PATH)
image_array = file.read()  # Leaving band number empty in read operation will read entire raster to array

# We should now have an array with 3 dimensions: Band, X, Y (or some combination thereof)
print(image_array.shape)
Now that we've read our raster into a three dimensional Numpy array, we can easily perform calculations on the array just like we would if calculating a single number. Here we've also defined the array index of each band as a separate variable to make things clearer. We're going to calculate RENDVI, a relatively simple index to calculate.
# CHANGE THESE TO THE INDICES OF 750nm AND 705nm BAND IN YOUR FILE
band750 = 23
band705 = 19

# RENDVI calculation
rendvi_array = (image_array[band750] - image_array[band705]) / (image_array[band750] + image_array[band705])
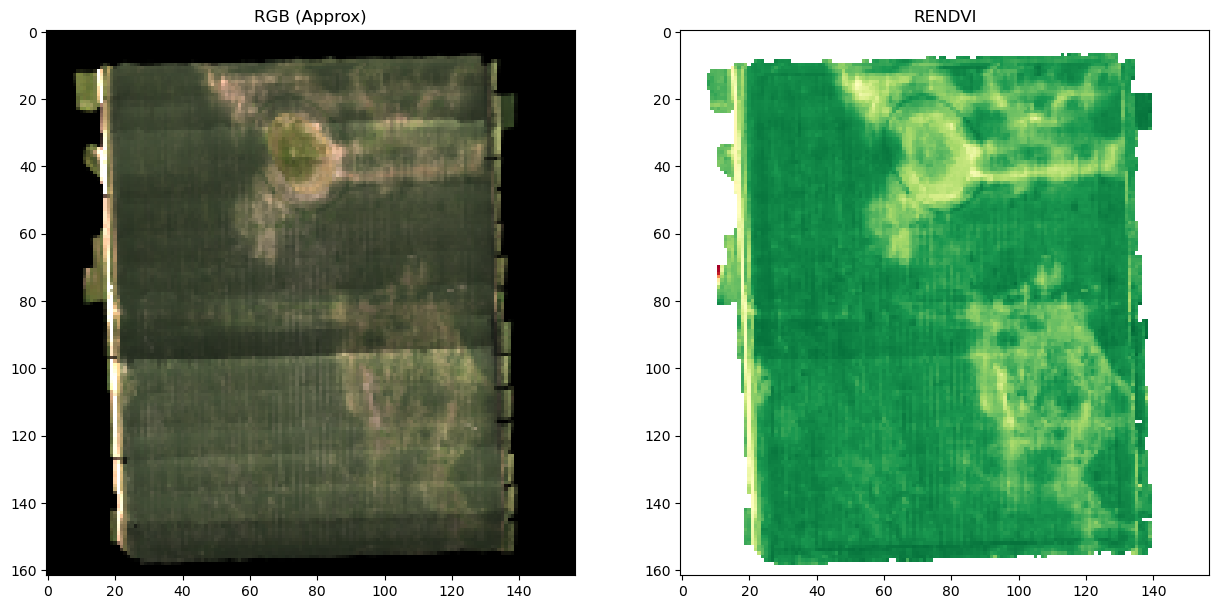
It's that easy! If we plot the resulting array next to RGB bands, we would see the following image:

There is a a more detailed example of index calculations and plotting available on the Plant Health Indices page.
Numerical Expressions
Numpy is fantastic for simple array calculations, however when we look at more complex equations it can get very hard to understand, very quickly. We also would run into issues if we wanted to calculate multiple indices, and automate the process of finding band centers. Luckily, there is an additional package (NumExpr) that allows us to define our equations using a string, and provide our band indexes as a dictionary.
We can use the same read operation as in the above example:
import rasterio

FILE_PATH = "/vsis3/wyvern-drone-data-processed/processed/SFB1516/WYVERN_SFB1516_20220726_v0_1_0_5mGSD.tiff"

file = rasterio.open(FILE_PATH)
image_array = file.read()  # Leaving band number empty in read operation will read entire raster to array

# We should now have an array with 3 dimensions: Band, X, Y (or some combination thereof)
print(image_array.shape)
We can then define our equations and band mapping dictionaries:
RENDVI_EQUATION = "(b750 - b705) / (b750 + b705)"
VREI2_EQUATION = "(b734 - b747) / (b715 + b726)"
MTVI2_EQUATION = "(1.5 * (1.2 * (b800 - b550) - 2.5 * (b670 - b550))) / sqrt((2 * b800 + 1) ** 2 - (6 * b800 - 5 * sqrt(b670)) - 0.5)"

band_map_dictionary = {
    "b750": 23,
    "b705": 19,
    "b734": 22,
    "b747": 23,
    "b715": 20,
    "b726": 21,
    "b800": 26,
    "b550": 8,
    "b670": 16,
}
We can then use NumExpr to evaluate these numerical expressions quickly and easily!
import numexpr as ne

rendvi_array = ne.evaluate(RENDVI_EQUATION, local_dict=band_map_dictionary)
vrei2_array = ne.evaluate(VREI2_EQUATION, local_dict=band_map_dictionary)
mtvi_array = ne.evaluate(MTVI2_EQUATION, local_dict=band_map_dictionary)
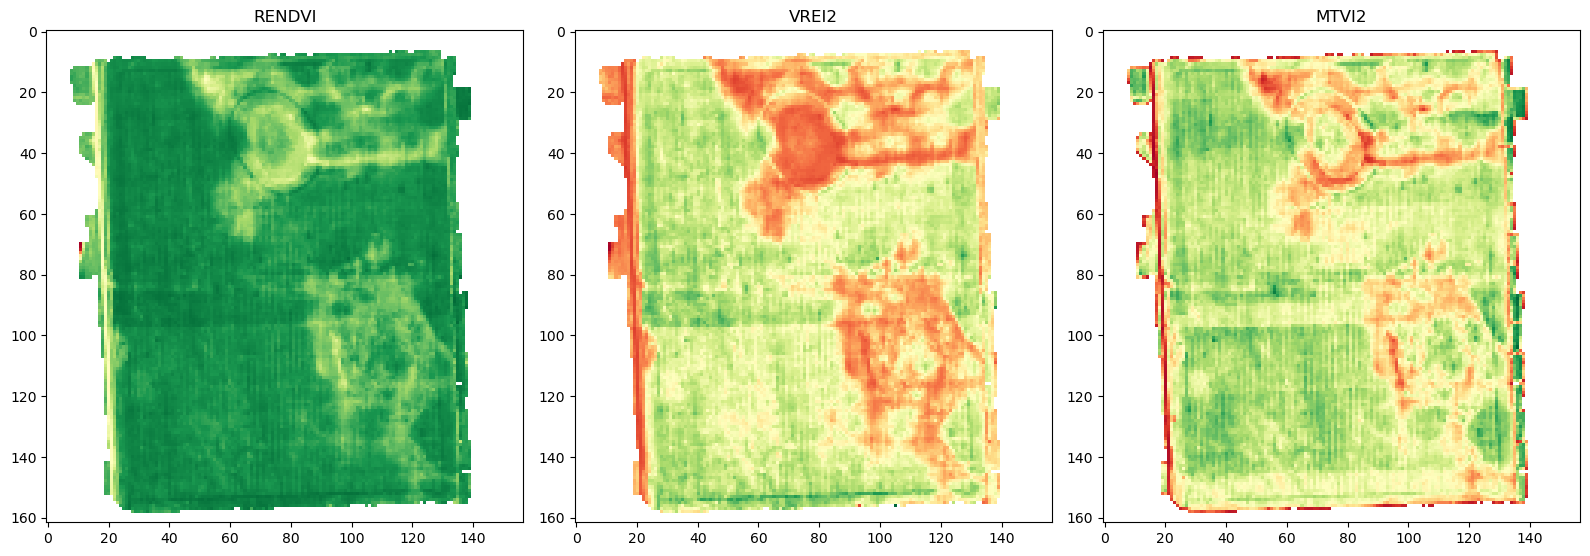
Plotting these using indices using matplotlib, we can see that the RENDVI is consistent with what was observed in the above Numpy example.

Other Packages
Many Python packages meant for remote sensing data will also include helpful functions for calculating indices. There also exists a wider ecosystem outside of Python for analysis of multispectral & hyperspectral data that is worth diving into!
EarthPy
EarthPy provides a userful normalized_diff() function, which can be used to calculate indices such as NDVI
Xarray-Spatial
Xarray-spatial has built in functions for calculating a number of useful multispectral indices using Xarray arrays, including NDVI, SAVI, and True Color
Awesome-Spectral-Indices
David Montero Loaiza's Awesome Spectral Indices project contains a number of packages in different languages for calculating multispectral indices. For the Python ecosystem, Spyndex is available for use. The advantage of this system is that a standard database of indices is pulled from, instead of having to form the equations yourself.