Hyperspectral basics
A hyperspectral image records light in many narrow, adjacent bands, so every pixel carries a spectrum rather than three colour values. The same technique is used in food sorting, pharmaceuticals, and astronomy. Here we look at it from orbit. This page starts with the light itself, then compares the three kinds of optical Earth observation imagery (panchromatic, multispectral, and hyperspectral) and what each can and can't tell you.
Electromagnetic spectrum
Light is electromagnetic radiation, and the electromagnetic spectrum is the full range of it, ordered by wavelength from gamma rays to radio waves. Optical Earth observation works in a narrow slice near the middle: visible light from roughly 400 to 700 nm, the near-infrared (NIR) from 700 to about 1,000 nm, and the shortwave infrared (SWIR) from about 1,000 to 2,500 nm. Visible and near-infrared together are called the VNIR.
Sunlight reaches the surface, and each material absorbs some wavelengths and reflects others. Which ones depends on what the material is made of. A satellite measures the reflected light, and the pattern of what's missing is the information.
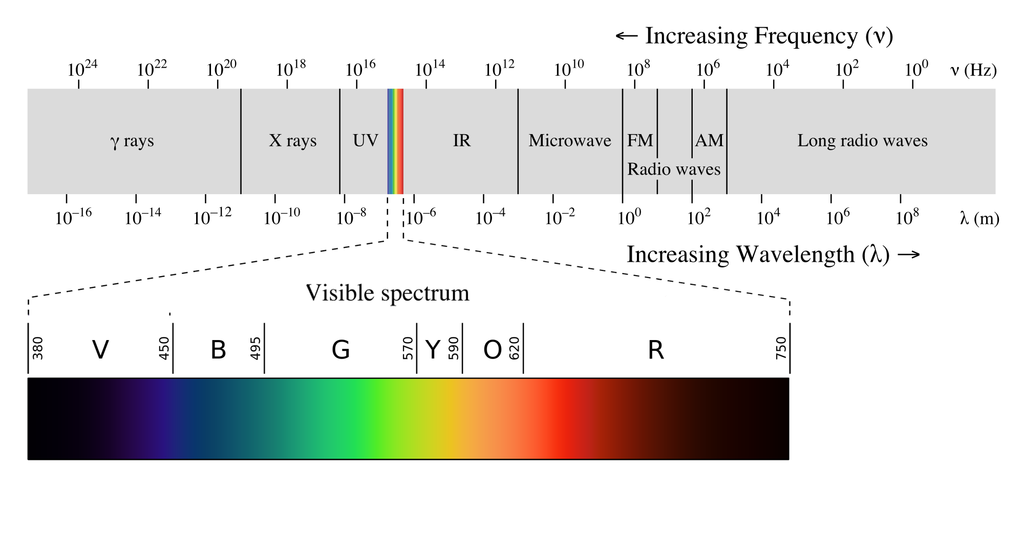
The electromagnetic spectrum, with the visible range expanded. Optical satellites work in and just beyond the visible. [4]
Wikipedia has a more detailed explanation of the electromagnetic spectrum if you want the physics.
Imagery types
Optical sensors differ mainly in how they divide up the spectrum: one wide band, a few wide bands, or many narrow ones. That choice sets what you can measure.
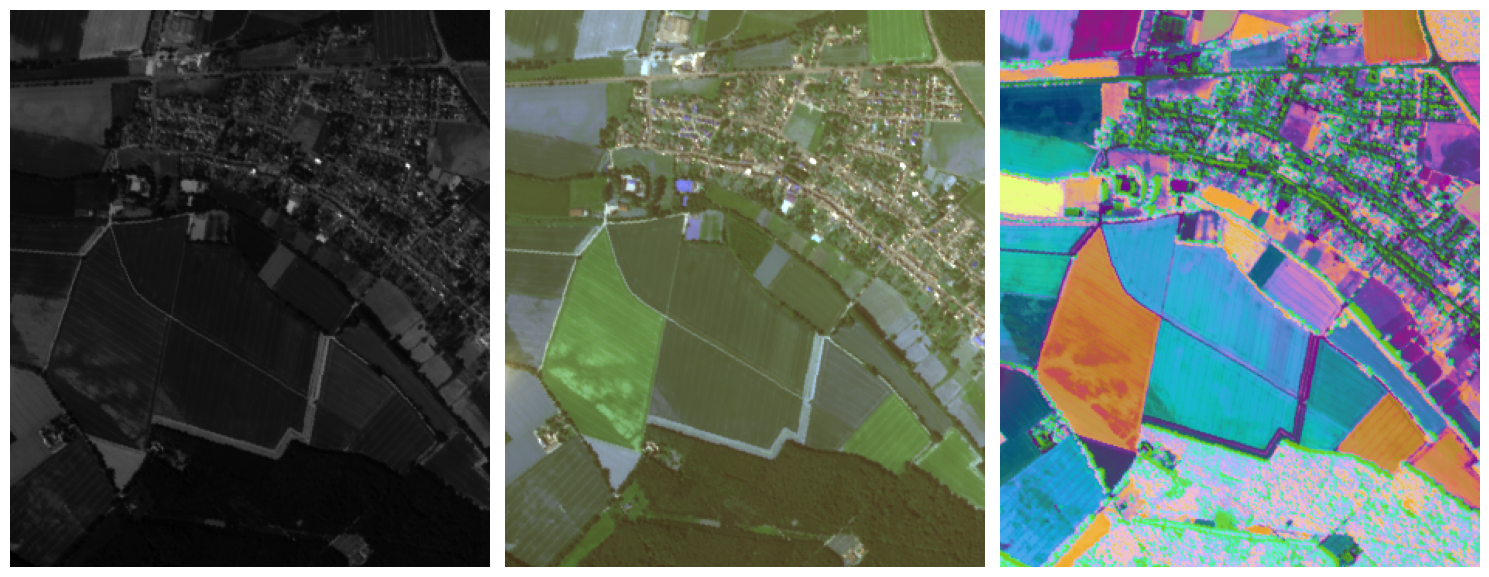
The same scene as panchromatic, multispectral, and hyperspectral imagery (the last reduced to three components for display), left to right.
Panchromatic
A panchromatic sensor records one wide band spanning most of the visible and near-infrared. A single wide band collects much more light than a narrow one, so each pixel can be made smaller while still getting a clean signal. That's why the panchromatic band is usually the sharpest image a satellite produces. What it gives up is colour: a panchromatic image records only how bright each pixel is.
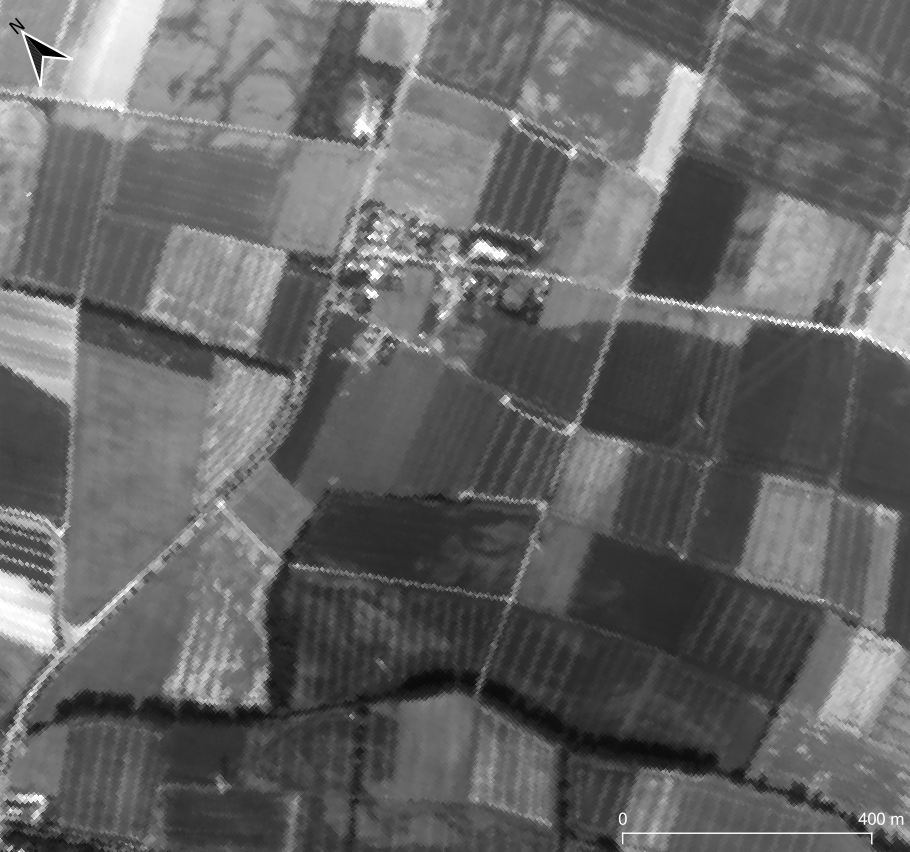
A panchromatic band: fine detail, brightness only.
Panchromatic imagery is often combined with lower-resolution colour bands from the same satellite in a process called pansharpening, which uses the panchromatic detail to sharpen the colour image. It works because the panchromatic band covers the same wavelengths as the colour bands it's sharpening.
Only pansharpen bands that fall inside the panchromatic band's wavelength range. Outside it, the detail you're transferring doesn't correspond to what the band measured, and the sharpened values are unreliable.
Multispectral
A multispectral sensor records a handful of wide bands, typically blue, green, red, and near-infrared. Some add red edge bands, between red and near-infrared, and SWIR bands. Sentinel-2 has 13 bands and Landsat 8 and 9 have 11.
Wide bands can overlap, so light at one wavelength registers in two bands at once. Figure 1 shows this for a typical four-band sensor, where the blue and green bands overlap considerably.

Figure 1: Spectral response of a typical four-band multispectral satellite. Where two curves overlap, both bands record the same light. [1]
Figure 2 shows reflectance spectra for soil, vegetation, and water, with typical multispectral bands as grey bars. The bands leave most of the spectrum unsampled, but they still separate these three materials easily, because vegetation reflects far more near-infrared light than soil or water.

Figure 2: Soil, vegetation, and water spectra, with typical multispectral bands in grey. Three very different shapes, easy to tell apart even with a few wide bands. [2]
That works when the materials are very different. It stops working when they're similar.
Hyperspectral
A hyperspectral sensor records many narrow, adjacent bands. Instead of one number averaged over a 100 nm wide band, you get a sample every 10 to 20 nm or so, fine enough to resolve individual absorption features: the chlorophyll absorption near 670 nm, the steep rise of the red edge, or the narrow dips that identify a particular mineral.
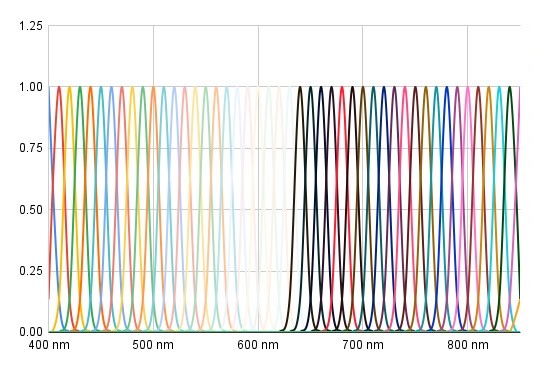
Figure 3: Hyperspectral band spacing across the VNIR. Each band is narrow, and together they sample the spectrum continuously.
Figure 4 shows why that matters. These vegetation types have spectra with the same overall shape, and they differ in small, specific places. Narrow bands resolve those differences. Wide multispectral bands average across them, which makes the types much harder to tell apart. The same applies to soils, minerals, and water constituents.

Figure 4: Reflectance spectra of several vegetation types. The differences between them are narrower than a multispectral band. [3]
Wyvern's Dragonette satellites image the VNIR from 445 to 870 nm, in 23 or 31 bands depending on the satellite. That range covers plant pigments, the red edge, water colour, and iron-bearing minerals. The SWIR, beyond 870 nm, holds features our sensors don't reach, such as leaf and soil water, clays, and carbonates; see additional datasets for missions that cover it.
More bands also means bigger files. A hyperspectral scene is many times the size of a multispectral one over the same area, which affects storage and processing time. Our tutorials show how to read only the part of a scene you need.
Where to go next
- Hyperspectral signatures: how a pixel's spectrum identifies what's in it, and what happens when a pixel contains more than one material.
- Plant health indices: the most common use of narrow VNIR bands.
- Loading data in Python: open a real Dragonette scene and look at its bands.
References
[1] Schill, Steven & McNulty, Valerie Pietsch & Pollock, F. & Lüthje, Fritjof & Li, Jiwei & Knapp, David & Kington, Joe & McDonald, Trevor & Raber, George & Escovar-Fadul, Ximena & Asner, Gregory. (2021). Regional High-Resolution Benthic Habitat Data from Planet Dove Imagery for Conservation Decision-Making and Marine Planning. Remote Sensing. 13. 4215. 10.3390/rs13214215.
[2] Pham, Binh. (2018). Satellite remote sensing of the variability of the continental hydrology cycle in the lower Mekong basin over the last two decades. 10.13140/RG.2.2.27136.07686.
[3] Govender, Megandhren & Chetty, Kershani & Bulcock, Hartley. (2007). A review of hyperspectral remote sensing and its application in vegetation and water resource studies. Water S.A. 33. 10.4314/wsa.v33i2.49049.
[4] Ronan, Gringer. EM spectrum, revised diagram with re-aligned spectrum. commons.wikimedia.org/wiki/File:EM_spectrumrevised.png